

Question: I was provided with the wrong answer from another tutor of 43.45 The estimated distribution (in millions) of the population by age in a certain
I was provided with the wrong answer from another tutor of 43.45
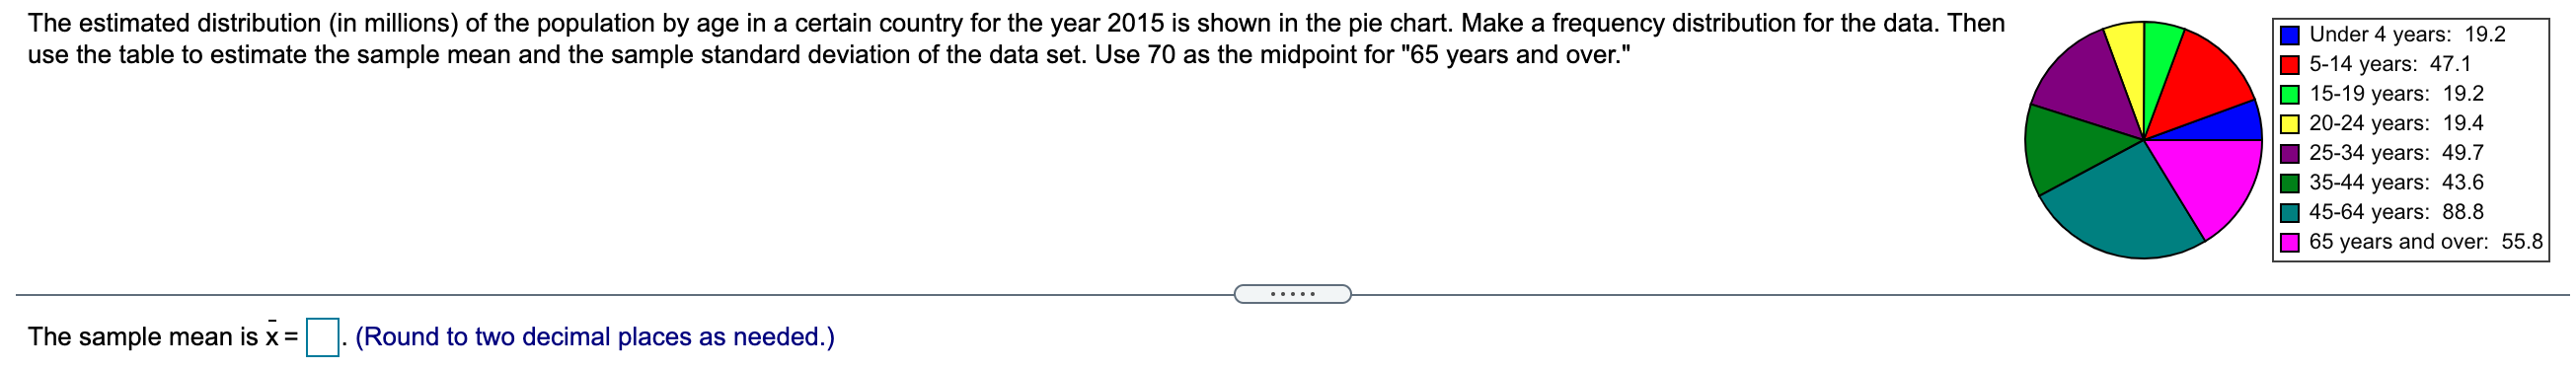
The estimated distribution (in millions) of the population by age in a certain country for the year 2015 is shown in the pie chart. Make a frequency distribution for the data. Then use the table to estimate the sample mean and the sample standard deviation of the data set. Use 70 as the midpoint for "65 years and over." I Under4 years: 19.2 I 5-14 years: 47.1 15-19 years: 19.2 [I 20-24 years: 19.4 I 25-34 years: 49.7 I 35-44 years: 43.6 I 4564 years: 88.8 I 65 years and over: 55.8 The sample mean is )2 = . (Round to two decimal places as needed.)
Step by Step Solution
There are 3 Steps involved in it
1 Expert Approved Answer
Step: 1 Unlock

Question Has Been Solved by an Expert!
Get step-by-step solutions from verified subject matter experts
Step: 2 Unlock
Step: 3 Unlock