

Question: i. What does curve X indicate? ii. What does curve Y indicate? iii. Explain briefly the phenomenon demonstrated by the plot. X 100 Y Activity
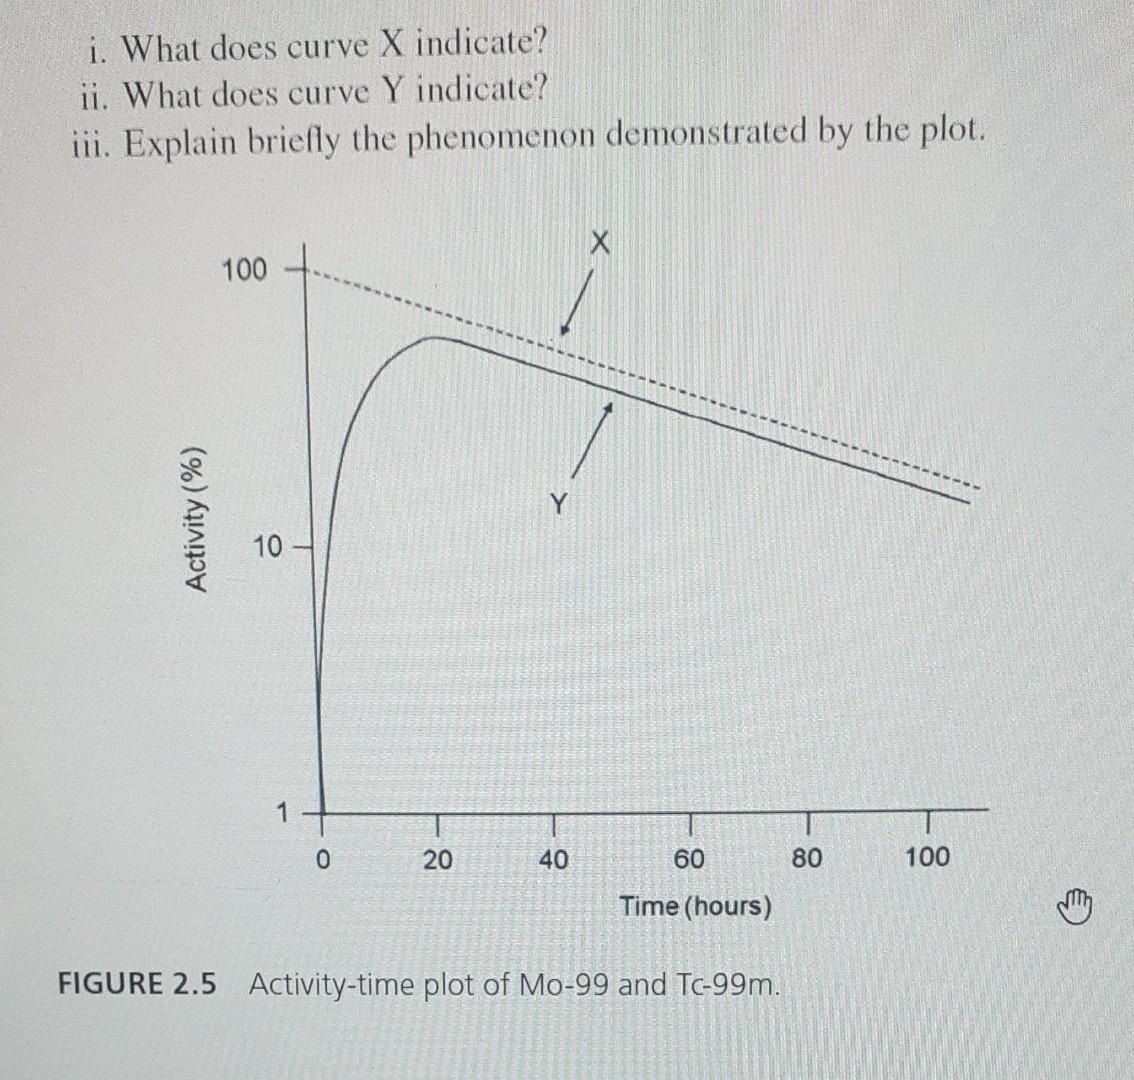
i. What does curve X indicate? ii. What does curve Y indicate? iii. Explain briefly the phenomenon demonstrated by the plot. X 100 Y Activity (%) 10 1 0 20 40 60 80 100 Time (hours) FIGURE 2.5 Activity-time plot of Mo-99 and Tc-99m
Step by Step Solution
There are 3 Steps involved in it
1 Expert Approved Answer
Step: 1 Unlock

Question Has Been Solved by an Expert!
Get step-by-step solutions from verified subject matter experts
Step: 2 Unlock
Step: 3 Unlock