

Question: ( i ) Which chart best displays these data? Why? Clustered column chart with table is preferred as it clearly depicts differences in production by
i
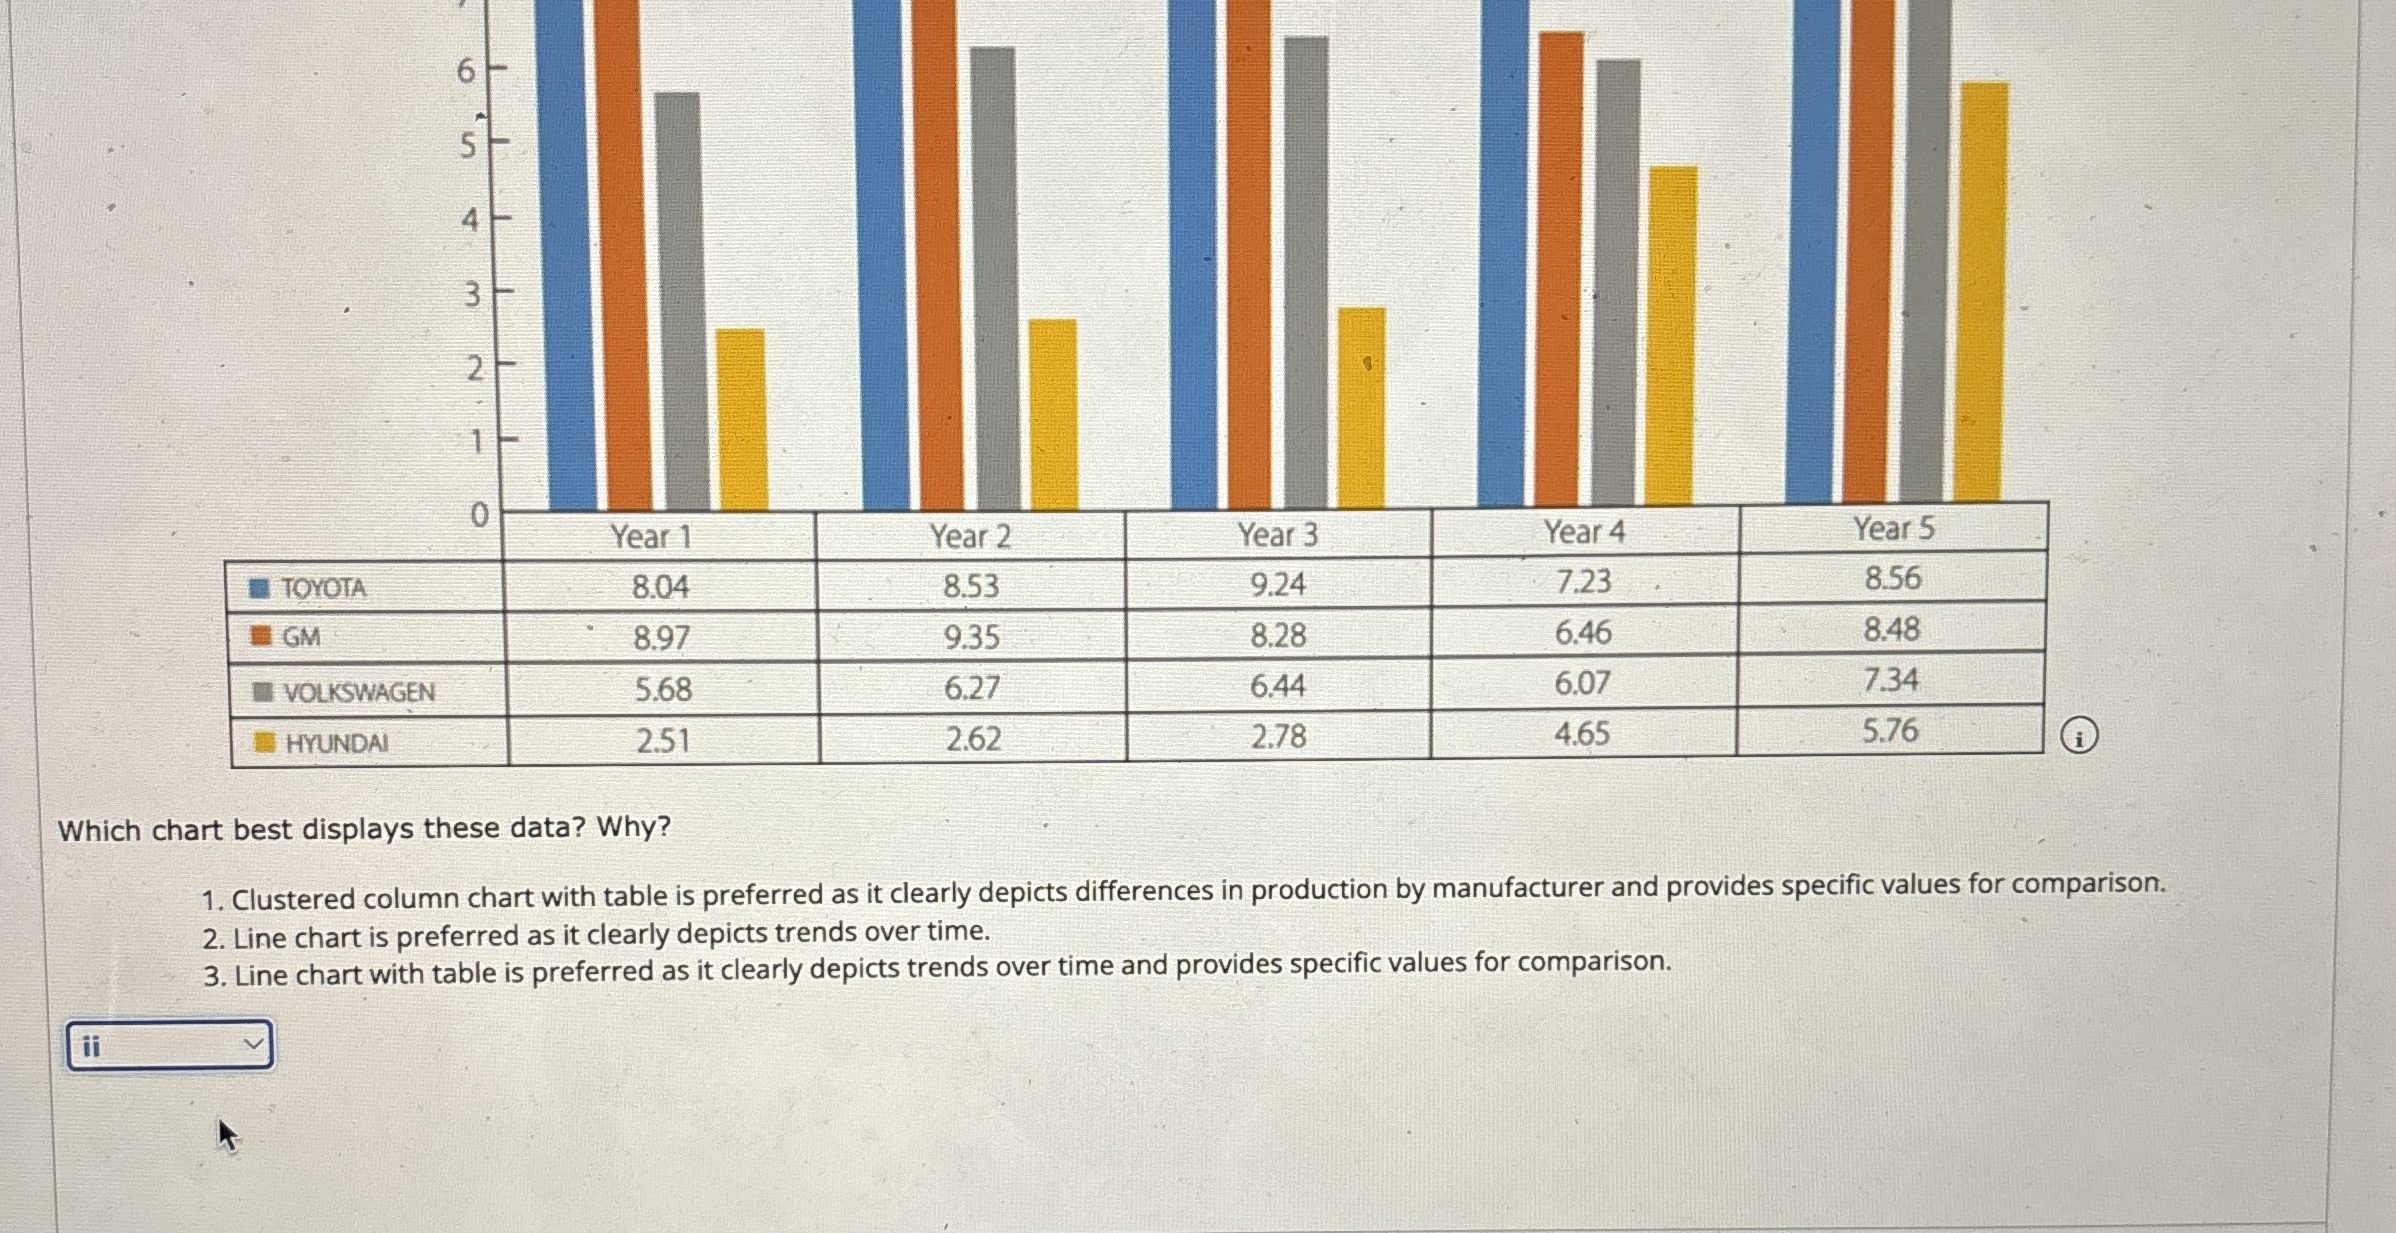
Which chart best displays these data? Why?
Clustered column chart with table is preferred as it clearly depicts differences in production by manufacturer and provides specific values for comparison.
Line chart is preferred as it clearly depicts trends over time.
Line chart with table is preferred as it clearly depicts trends over time and provides specific values for comparison.
Step by Step Solution
There are 3 Steps involved in it
1 Expert Approved Answer
Step: 1 Unlock

Question Has Been Solved by an Expert!
Get step-by-step solutions from verified subject matter experts
Step: 2 Unlock
Step: 3 Unlock