

Question: I will thumbs up Figure out the net present value of the following 5 choices through the year 2009. (Use a discount rate of 30%
I will thumbs up
Figure out the net present value of the following 5 choices through the year 2009. (Use a discount rate of 30% and attach an Excel page to show what numbers you utilized and how you did the NPV computation.
Phase I/II Production Phase III Production
(a) Nucleon Nucleon
(b) Nucleon Licensee
(c) Contractor Nucleon
(d) Contractor Licensee
(e) Licensee Licensee
Compare options (a) through (e) using two criteria:
- Which choice has the largest NPV?
- Figure out what Nucleons competitive advantage(s) would be if it chooses each of the five options (for example, if Nucleon chooses Option (e) then manufacturing capabilities are unlikely to be part of Nucleons competitive advantage). Also comment on the ability of Nucleon to sustain the advantage implied with each of the five options.
- The timeframe for NPV calculation should be 1991-2009. You should calculate net cashflow for each year in each option.
Based on your analysis of NPV and competitive advantage, which option do you recommend?
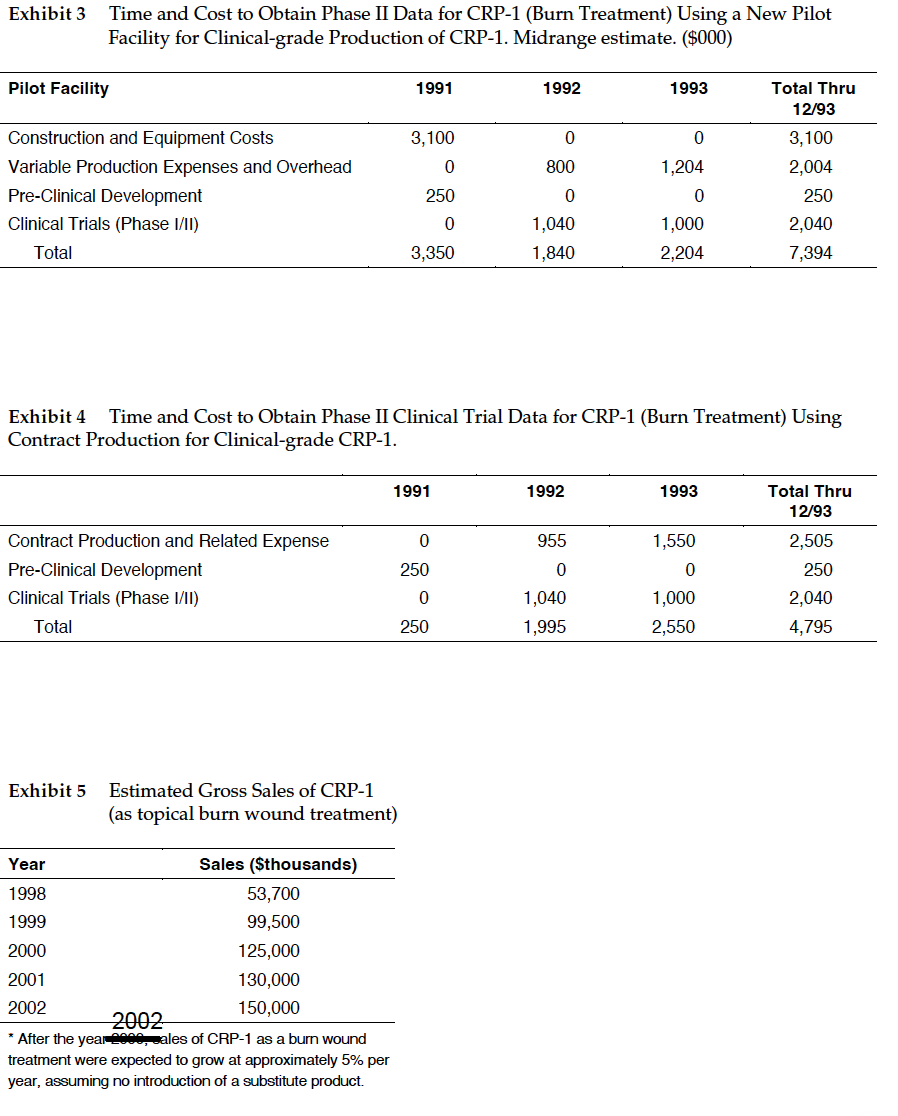
Exhibit 3 Time and Cost to obtain Phase II Data for CRP-1 (Burn Treatment) Using a New Pilot Facility for Clinical-grade Production of CRP-1. Midrange estimate. ($000) Pilot Facility 1991 1992 1993 Total Thru 12/93 3,100 0 0 0 800 1,204 Construction and Equipment Costs Variable Production Expenses and Overhead Pre-Clinical Development Clinical Trials (Phase 1/11) Total 250 0 0 3,100 2,004 250 2,040 7,394 0 1,040 1,840 1,000 2,204 3,350 Exhibit 4 Time and Cost to Obtain Phase II Clinical Trial Data for CRP-1 (Burn Treatment) Using Contract Production for Clinical-grade CRP-1. 1991 1992 1993 Total Thru 12/93 0 955 1,550 250 0 0 Contract Production and Related Expense Pre-Clinical Development Clinical Trials (Phase 1/11) Total 2,505 250 2,040 4,795 0 250 1,040 1,995 1,000 2,550 Exhibit 5 Estimated Gross Sales of CRP-1 (as topical burn wound treatment) Year Sales ($thousands) 1998 53,700 1999 99,500 2000 125,000 2001 130,000 2002 150,000 2002 * After the year eales of CRP-1 as a burn wound treatment were expected to grow at approximately 5% per year, assuming no introduction of a substitute product
Step by Step Solution
There are 3 Steps involved in it

Get step-by-step solutions from verified subject matter experts