

Question: I would appreciate it if you could help with these questions along with showing an explanation. The following diagram provides the average and marginal cost
I would appreciate it if you could help with these questions along with showing an explanation.
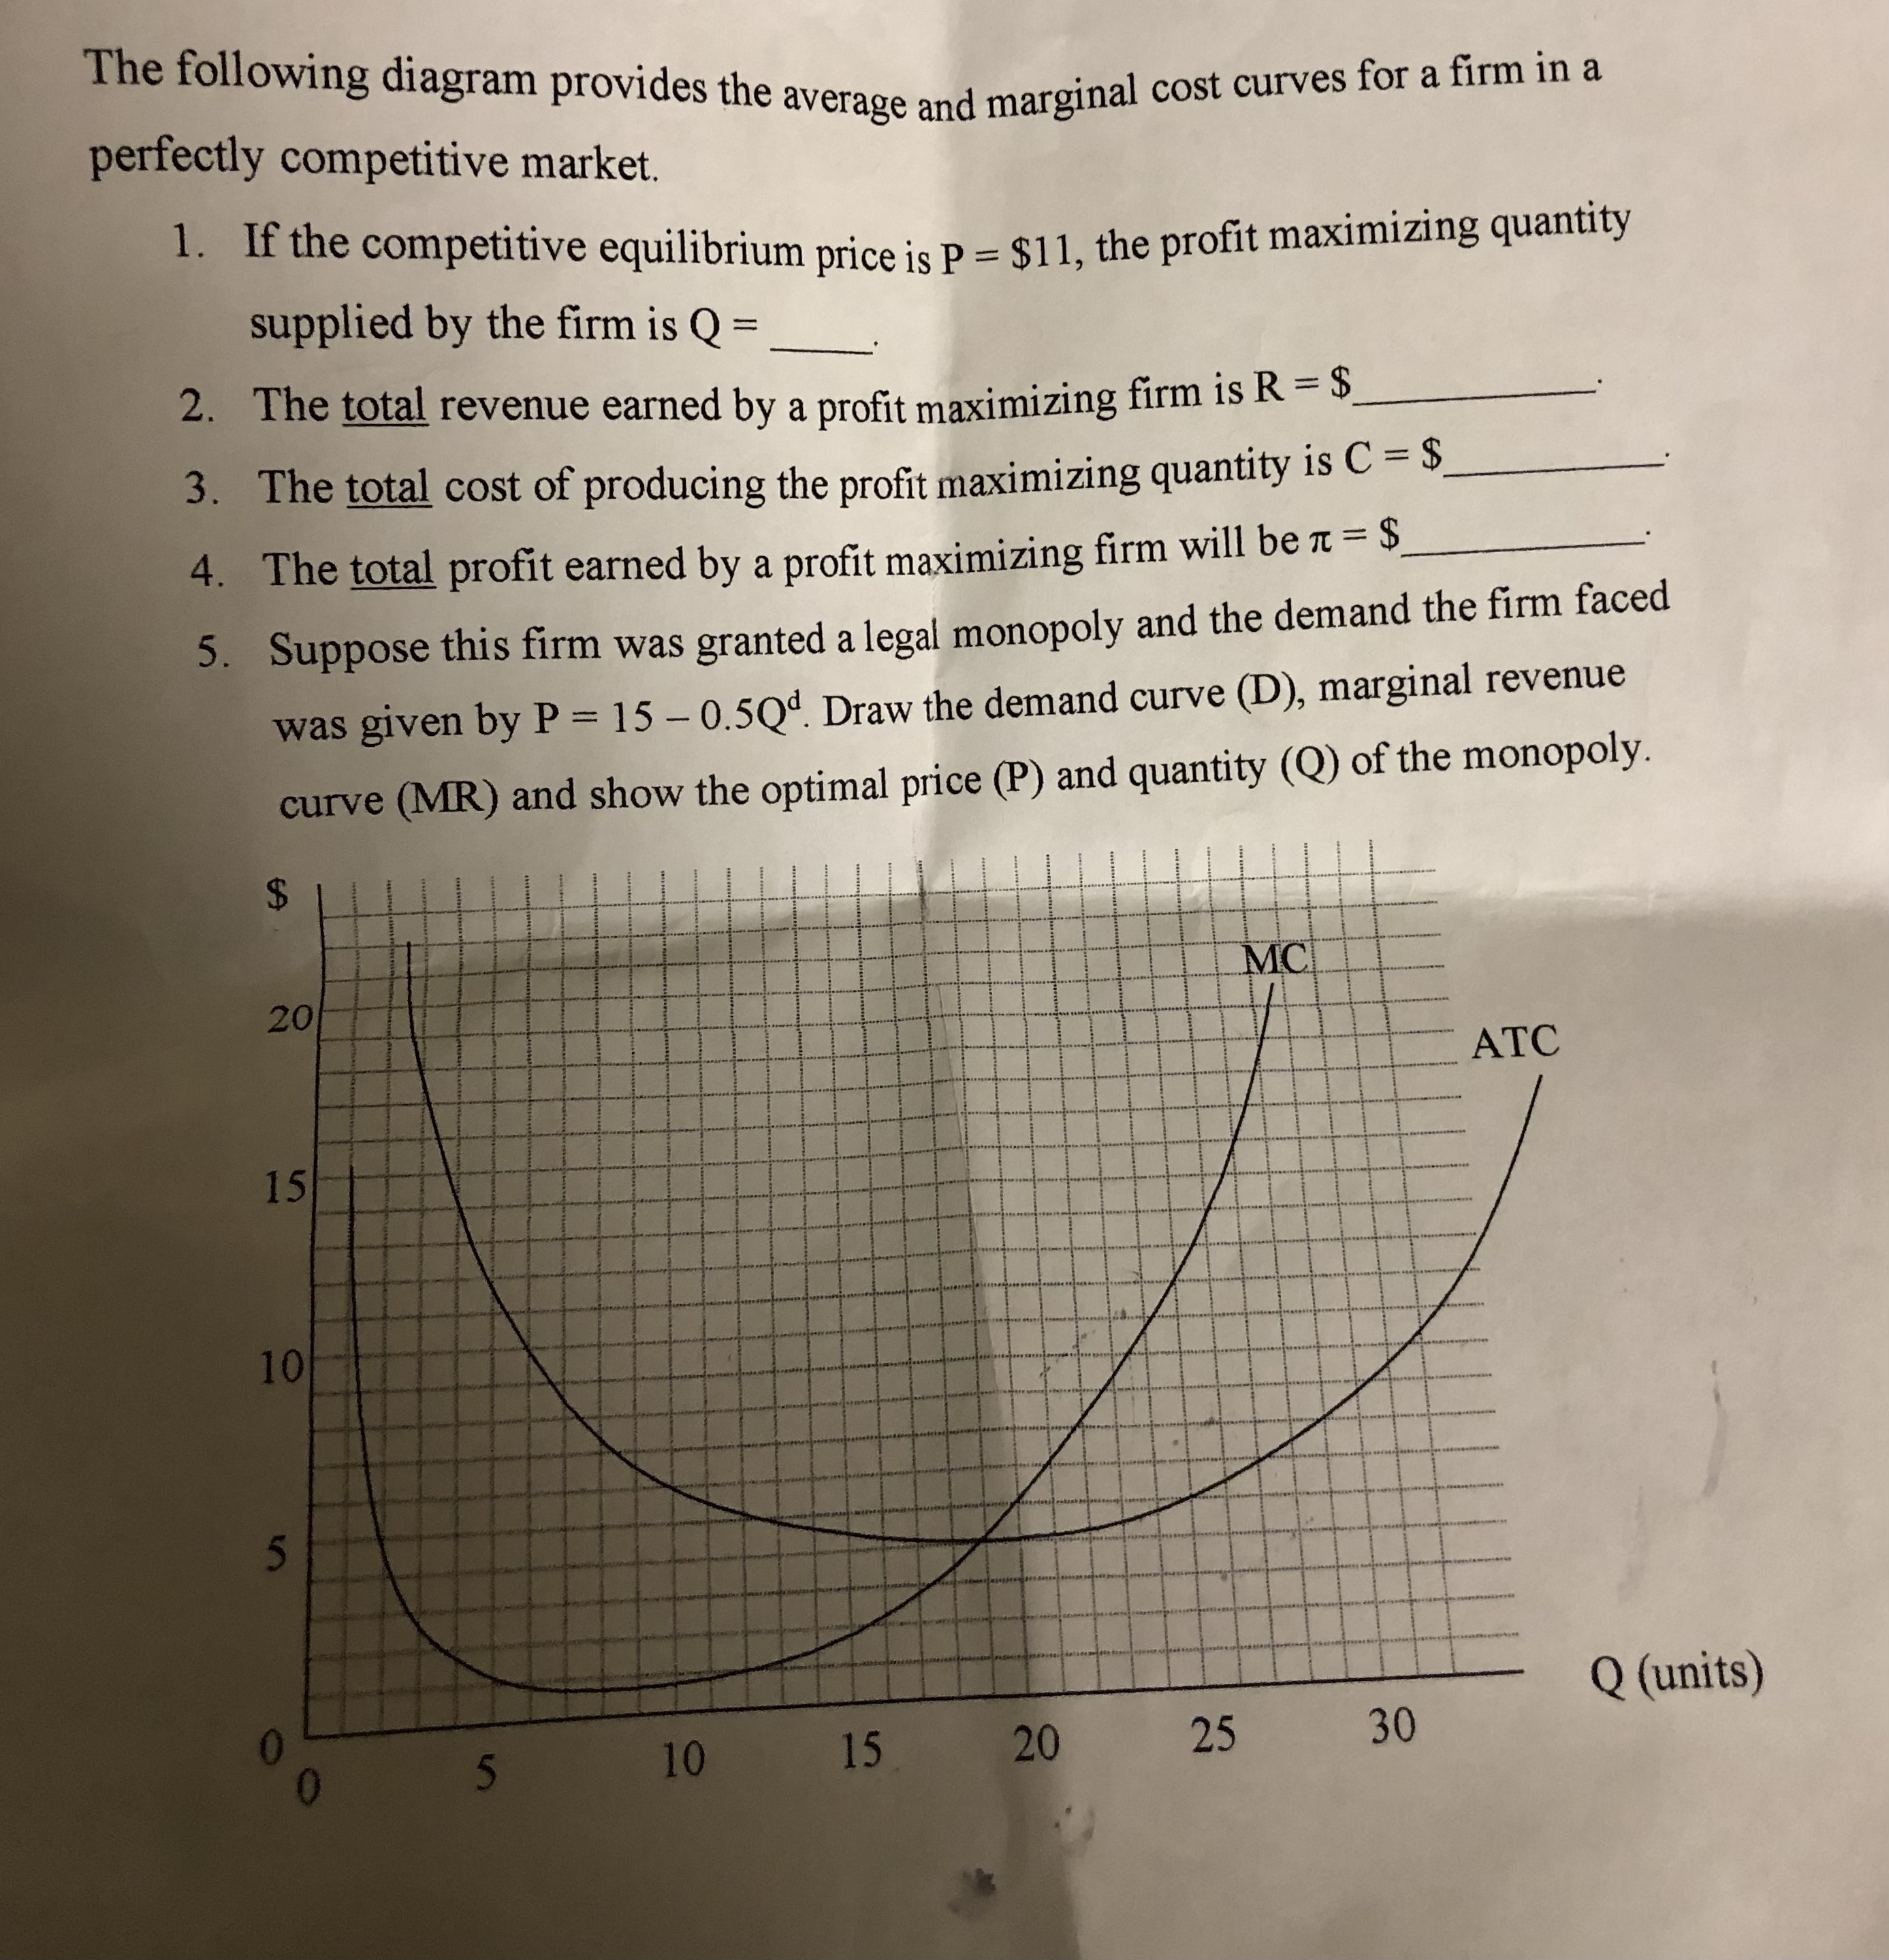
The following diagram provides the average and marginal cost curves for a firm in a perfectly competitive market. 1. If the competitive equilibrium price is P = $11, the profit maximizing quantity supplied by the firm is Q = 2. The total revenue earned by a profit maximizing firm is R = $ 3. The total cost of producing the profit maximizing quantity is C = $ 4. The total profit earned by a profit maximizing firm will be n = $ 5. Suppose this firm was granted a legal monopoly and the demand the firm faced was given by P = 15 -0.5Q. Draw the demand curve (D), marginal revenue curve (MR) and show the optimal price (P) and quantity (Q) of the monopoly. $ 20 MC ATC 15 10 5 0 Q (units) 5 10 15 20 25 30
Step by Step Solution
There are 3 Steps involved in it

Get step-by-step solutions from verified subject matter experts