

Question: I would like some detaile d step by step explanation for the following Inference for More Than Two Indepent Sample Exercise I only want answer


I would like some detailed step by step explanation for the following Inference for More Than Two Indepent Sample Exercise
I only want answer for part b

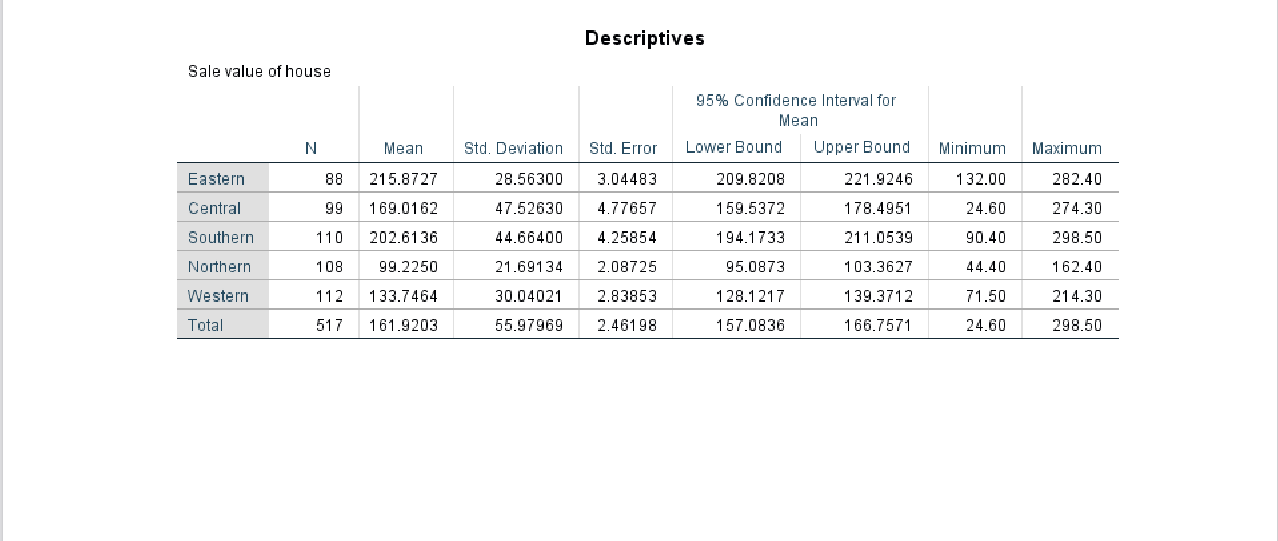
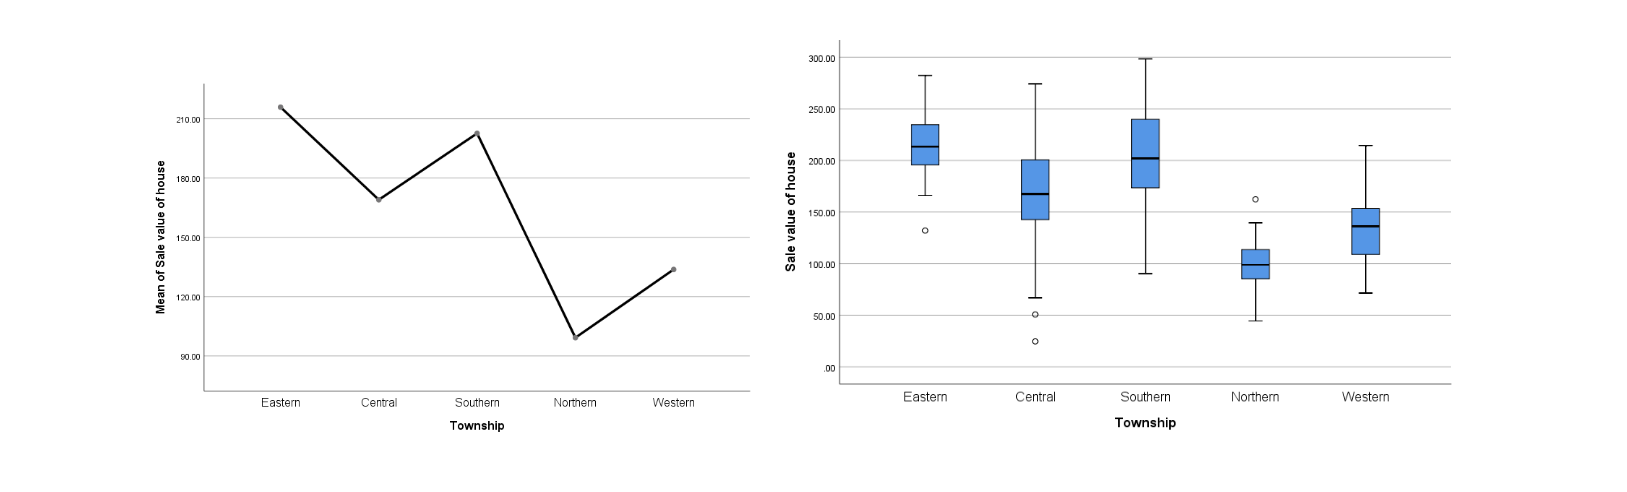
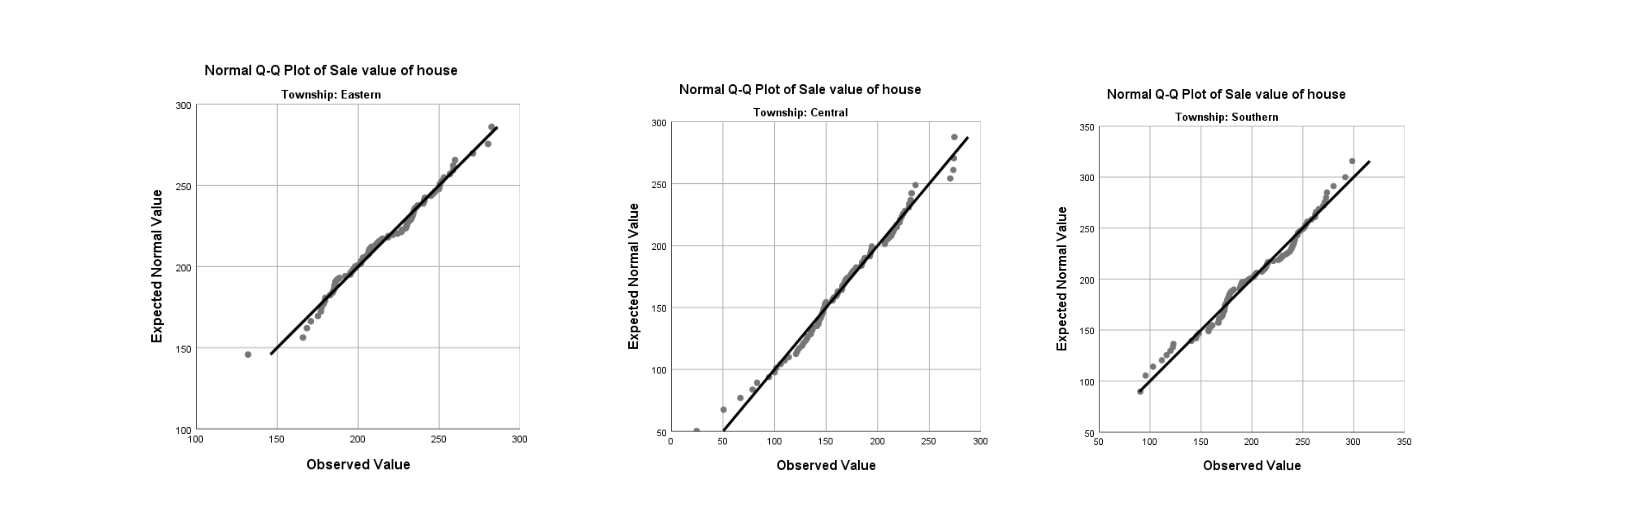

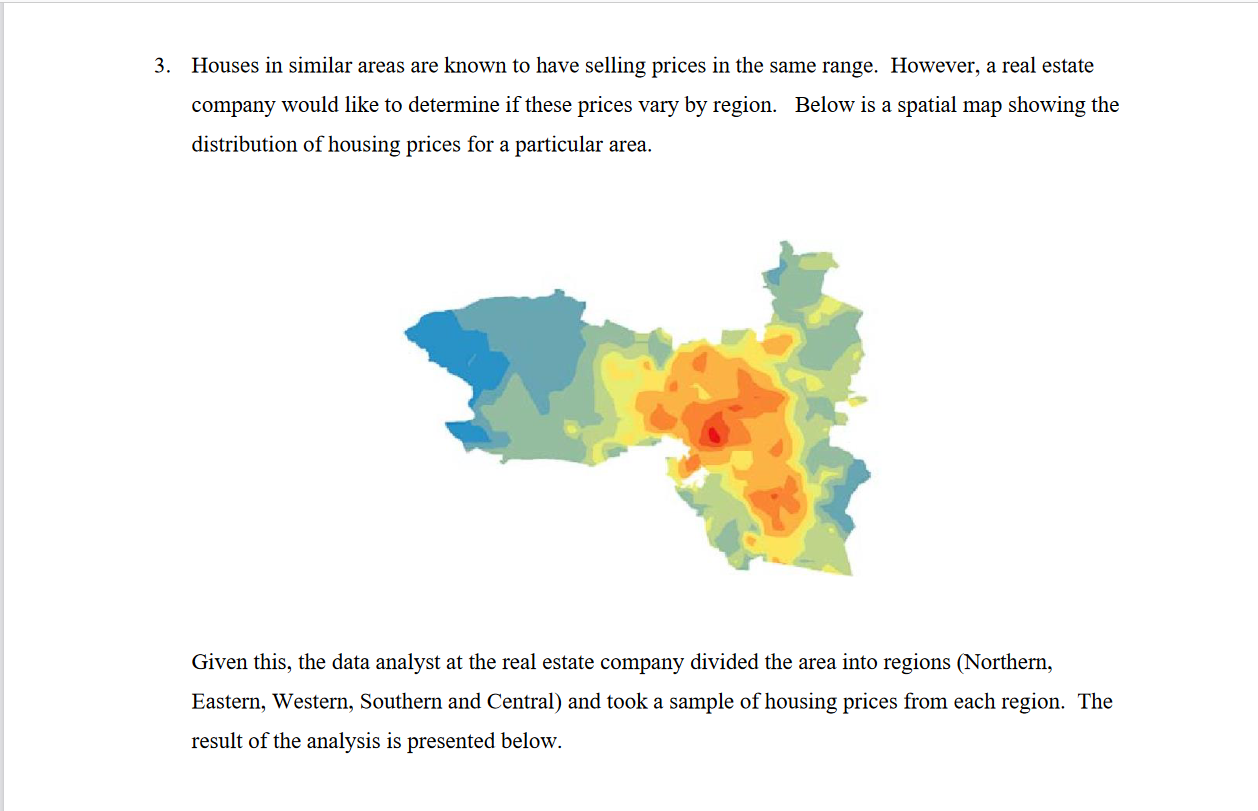
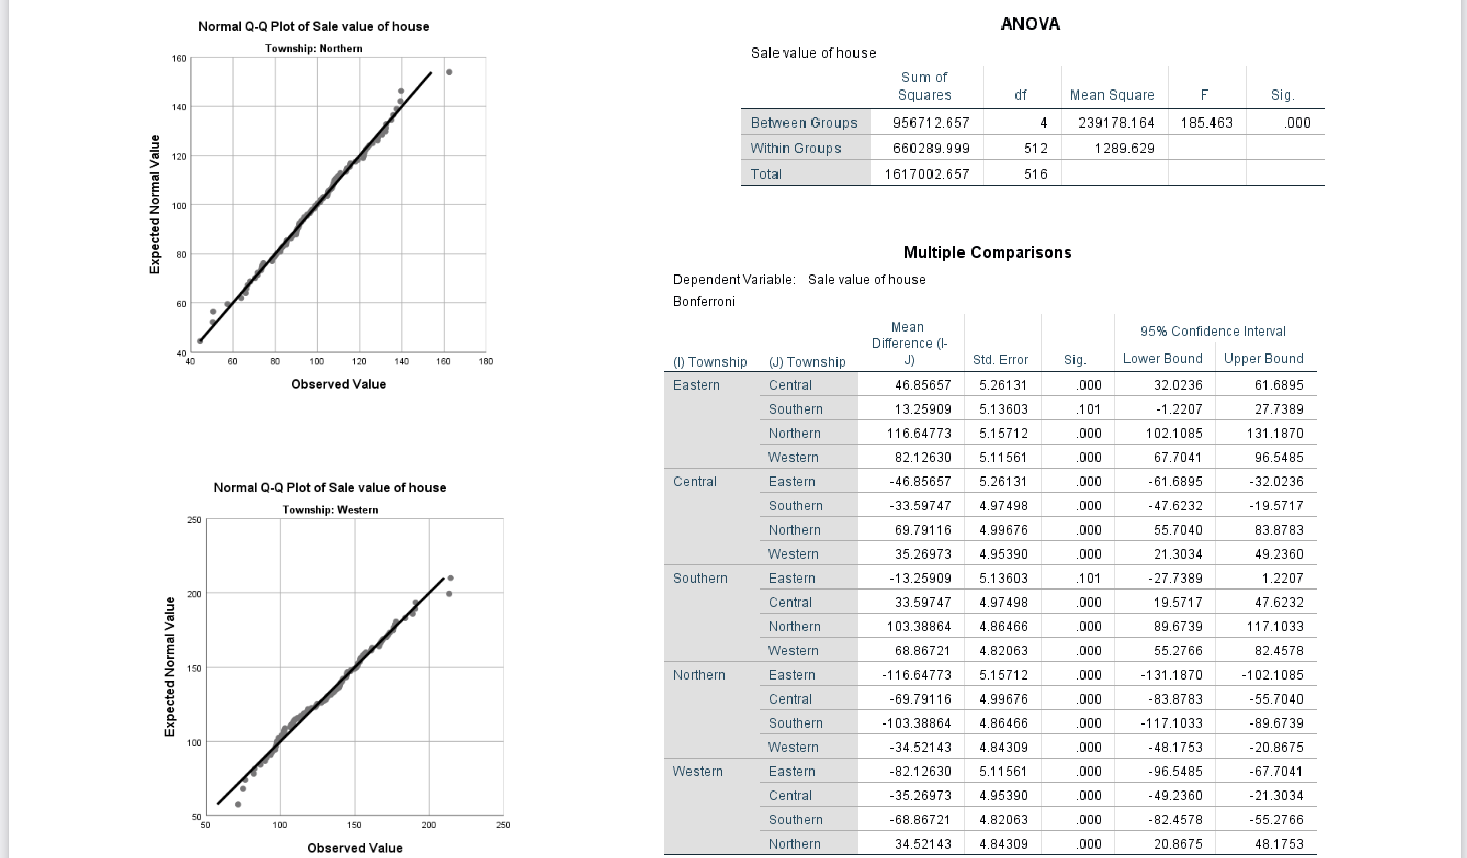
3. Houses in similar areas are known to have selling prices in the same range. However, a real estate company would like to determine if these prices vary by region. Below is a spatial map showing the distribution of housing prices for a particular area. Given this, the data analyst at the real estate company divided the area into regions (Northern, Eastern, Western, Southern and Central) and took a sample of housing prices from each region. The result of the analysis is presented below. Descriptives Sale value of house 95% Confidence Interval for Mean N Mean Std. Deviation Std. Error Lower Bound Upper Bound Minimum Maximum Eastern 88 215.8727 28.56300 3.04483 209.8208 221.9246 132.00 282.40 Central 99 169.0162 47.52630 4.77657 159.5372 178.4951 24.60 274.30 Southern 110 202.6136 44.66400 4.25854 194.1733 211.0539 90.40 298.50 Northern 108 99.2250 21.69134 2.08725 95.0873 103.3627 44.40 162.40 Western 112 133.7464 30.04021 2.83853 128.1217 139.3712 71.50 214.30 Total 517 161.9203 55.97969 2.46198 157.0836 166.7571 24.60 298.503DD.OD 250.00 210.00 200.00 80.00 O Sale value of house 150.DD O Mean of Sale value of house 150.CO 100.00 20,CC 50.DD 90.0 Eastern Central Southern Northern Western Central Southern Northem Western Eastern Township TownshipNormal Q-Q Plot of Sale value of house Normal Q-Q Plot of Sale value of house Normal Q-Q Plot of Sale value of house Township: Eastern 300 Township: Central Township: Southern 300 350 300 250 250 250 200 200 Expected Normal Value Expected Normal Value 200 Expected Normal Value 150 150 150 100 100 300 350 50 50 GO 100 100 150 200 250 300 100 150 200 250 100 300 50 150 200 250 Observed Value Observed Value Observed ValueNormal Q-Q Plot of Sale value of house ANOVA Township: Northern Sale value of house 160 Sum of Squares df Mean Square F Sig. 140 Between Groups 956712.657 4 239178.164 185.463 000 Within Groups 660289.999 512 289.629 20 Total 1617002.657 516 Expected Normal Value 100 Multiple Comparisons Dependent Variable: Sale value of house 60 Bonferroni Mean 95% Confidence Interval Difference (1- 80 100 120 140 160 180 I) Township (JJ) Township Std. Error Sig. Lower Bound Upper Bound Observed Value Eastern Central 46.85657 5.26131 000 32.0236 61.6895 Southern 13.25909 5.13603 101 -1.2207 27.7389 Northern 116.64773 5.15712 000 102.1085 131.1870 Western 82.12630 5.11561 000 67.7041 96.5485 Central Eastern -46.85657 5.26131 000 61.6895 -32.0236 Normal Q-Q Plot of Sale value of house -33.59747 4.97 498 000 47.6232 Township: Western Southern -19.5717 250 Northern 69.79116 4.99676 000 55.7040 83.8783 Western 35.26973 4.95390 000 21.3034 49.2360 Southern Eastern -13.25909 5.13603 101 27.7389 1.2207 200 Central 33.59747 4.97498 000 19.5717 17.6232 Northern 103.38864 4.86466 000 89.6739 117.1033 Western 68.86721 4.82063 000 55.2766 82.4578 Expected Normal Value 150 Northern Eastern -116.64773 5.15712 000 -131.1870 -102.1085 Central -69.79116 4.99676 000 83.8783 -55.7040 Southern -103.38864 4.86466 000 -117.1033 -89.6739 100 Western 34.52143 4.84 309 000 48.1753 20.8675 Western Eastern -82.12630 5.11561 000 -96.5485 -67.7041 Central 35.26973 4.95390 .000 49.2360 21.3034 Southern -68.86721 4.82063 000 82.4578 -55.27 66 10D 150 200 250 Northern 34.52143 000 Observed Value 4.84309 20.8675 48.1753a) b) Evaluate the assumptions for this test. Based on your conclusions, can the results of the test be trusted. More specic-ally, (i) determine whether you can pool the standard deviations; (ii) evaluate on the appropriateness of the test based on the boxplots and qqplots; { iii) use the boxplots to determine if there may be a difference in the means. Ensure you highlight which means you expect to be different and why; (iv) comment on the means plot. Regardless of your conclusions in part (a). determine whether at least one of the population mean housing prices is different from the others. Also calculate the pooled variance and the percentage of variation in housing price that is accounted for by the model. If applicable, determine which means are different. Ensure you write out each test as shown in class and the videos. If not appLicable, explain why
Step by Step Solution
There are 3 Steps involved in it

Get step-by-step solutions from verified subject matter experts