

Question: I would like some help solving this problem. The following assignment has been taken from Case Problem 2: US. Department of Transportation, located in your
I would like some help solving this problem.
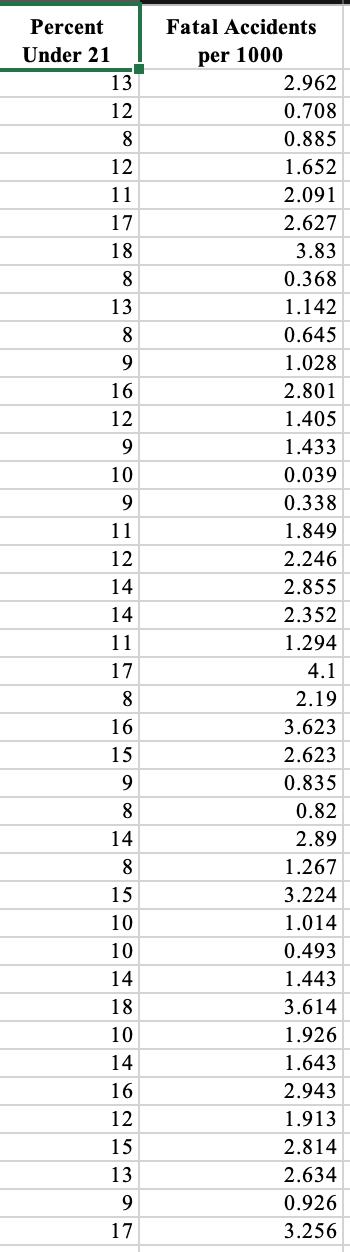
The following assignment has been taken from Case Problem 2: US. Department of Transportation, located in your textbook on page 721. As part of a study on transportation safety, the U.S. Department of Transportation collected data on the number of fatal accidents per 1000 licenses and the percentage of licensed drivers under the age of 21 in a sample of 42 cities. (Data collected over a one-year period are contained in the le titled Safety '3 .) 1. Develop numerical and graphical summaries of the data. 2. Use regression analysis to investigate the relationship between the number of fatal accidents and the percentage of drivers under the age of 21. Show your regression. Discuss Multiple R and R-squared and what they indicate about the relationship. 3. What conclusion and recommendations can you derive from your analysis? Submit your Excel spreadsheet and written conclusion here. Your conclusion can be written on the Excel spreadsheet, in a Word document, or typed in the textbox. You will be graded on your completion of the calculations in Excel and the explanation of your conclusion. Remember to use good grammar, spelling, and punctuation in your explanation and include citations if references are used to support your explanation. This assignment is worth 50 points.
Step by Step Solution
There are 3 Steps involved in it

Get step-by-step solutions from verified subject matter experts