

Question: I would like to generate a plot like the one below in which it combines the color map of the free energy surface and the
I would like to generate a plot like the one below in which it combines the color map of the free energy surface and the phi, psi space for the different delta T values. This is using linux gnuplot. I have generated these graphs separately, but how do I combine them into one graph using gnuplot?
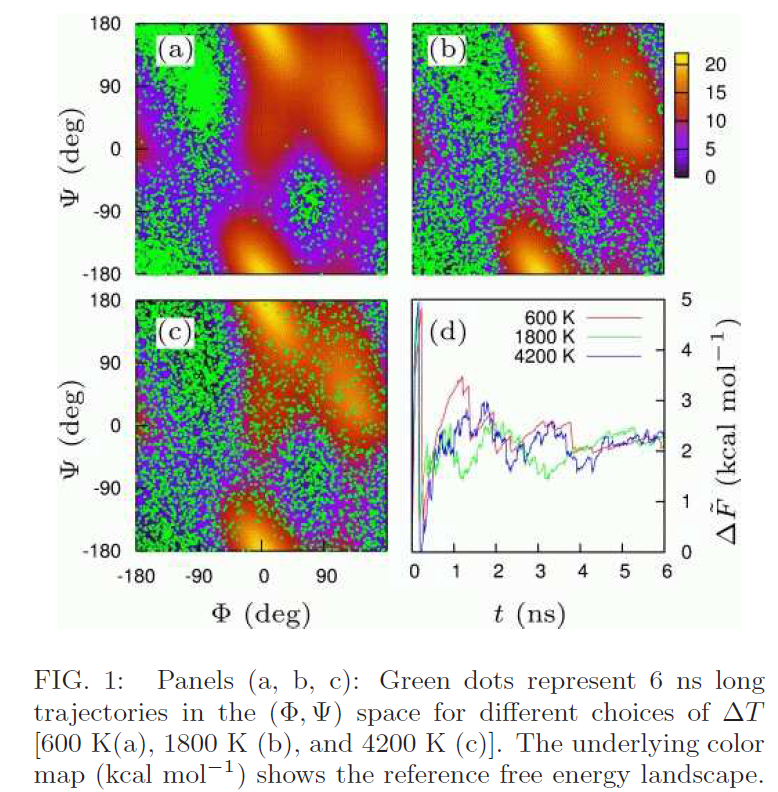
180 20 15 10 0 180 180 5 (d 1800 K 90 4200 K -90 180 180 -90 0 90 0 1 2 3 4 5 6 ? (deg) t (ns) FIG. Panels (a, b, c): Green dots represent 6 ns long (600 K(a), 1800 K (b), and 4200 K (c)]. The underlying color map (kcal mol-1) shows the reference free energy landscape 180 20 15 10 0 180 180 5 (d 1800 K 90 4200 K -90 180 180 -90 0 90 0 1 2 3 4 5 6 ? (deg) t (ns) FIG. Panels (a, b, c): Green dots represent 6 ns long (600 K(a), 1800 K (b), and 4200 K (c)]. The underlying color map (kcal mol-1) shows the reference free energy landscape
Step by Step Solution
There are 3 Steps involved in it

Get step-by-step solutions from verified subject matter experts