

Question: I would like to know how to explain these graphs above, both of them. Thanks 18 requity = expected return on equity 16 rassets =
I would like to know how to explain these graphs above, both of them.
Thanks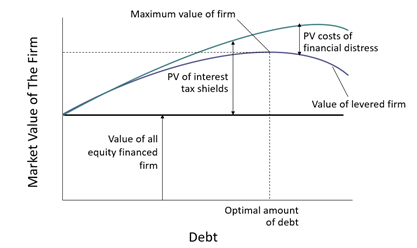
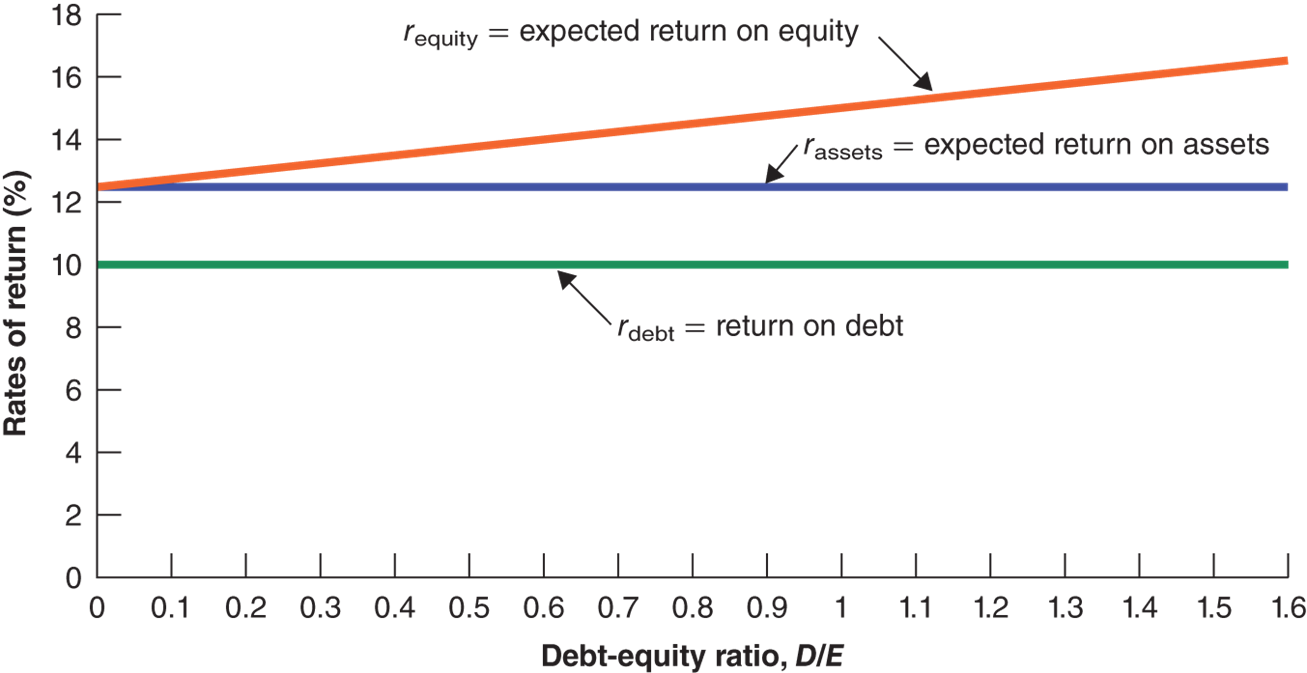
18 requity = expected return on equity 16 rassets = expected return on assets 4 2 0 Rates of return (%) 8 rdebt return on debt 4 2 o 1.1 1.2 1.3 1.4 1.5 1.6 0 0.1 0.2 0.3 0.4 0.5 0.6 0.7 0.8 0.9 1 Debt-equity ratio, DIE Maximum value of firm PV costs of financial distress PV of interest tax shields Market Value of The Firm Value of levered firm Value of all equity financed firm Optimal amount of debt Debt
Step by Step Solution
There are 3 Steps involved in it
1 Expert Approved Answer
Step: 1 Unlock

Question Has Been Solved by an Expert!
Get step-by-step solutions from verified subject matter experts
Step: 2 Unlock
Step: 3 Unlock