

Question: I would like to know your thoughts/recommendation about this post. For this discussion forum I would like to use an example which is similar to
I would like to know your thoughts/recommendation about this post.
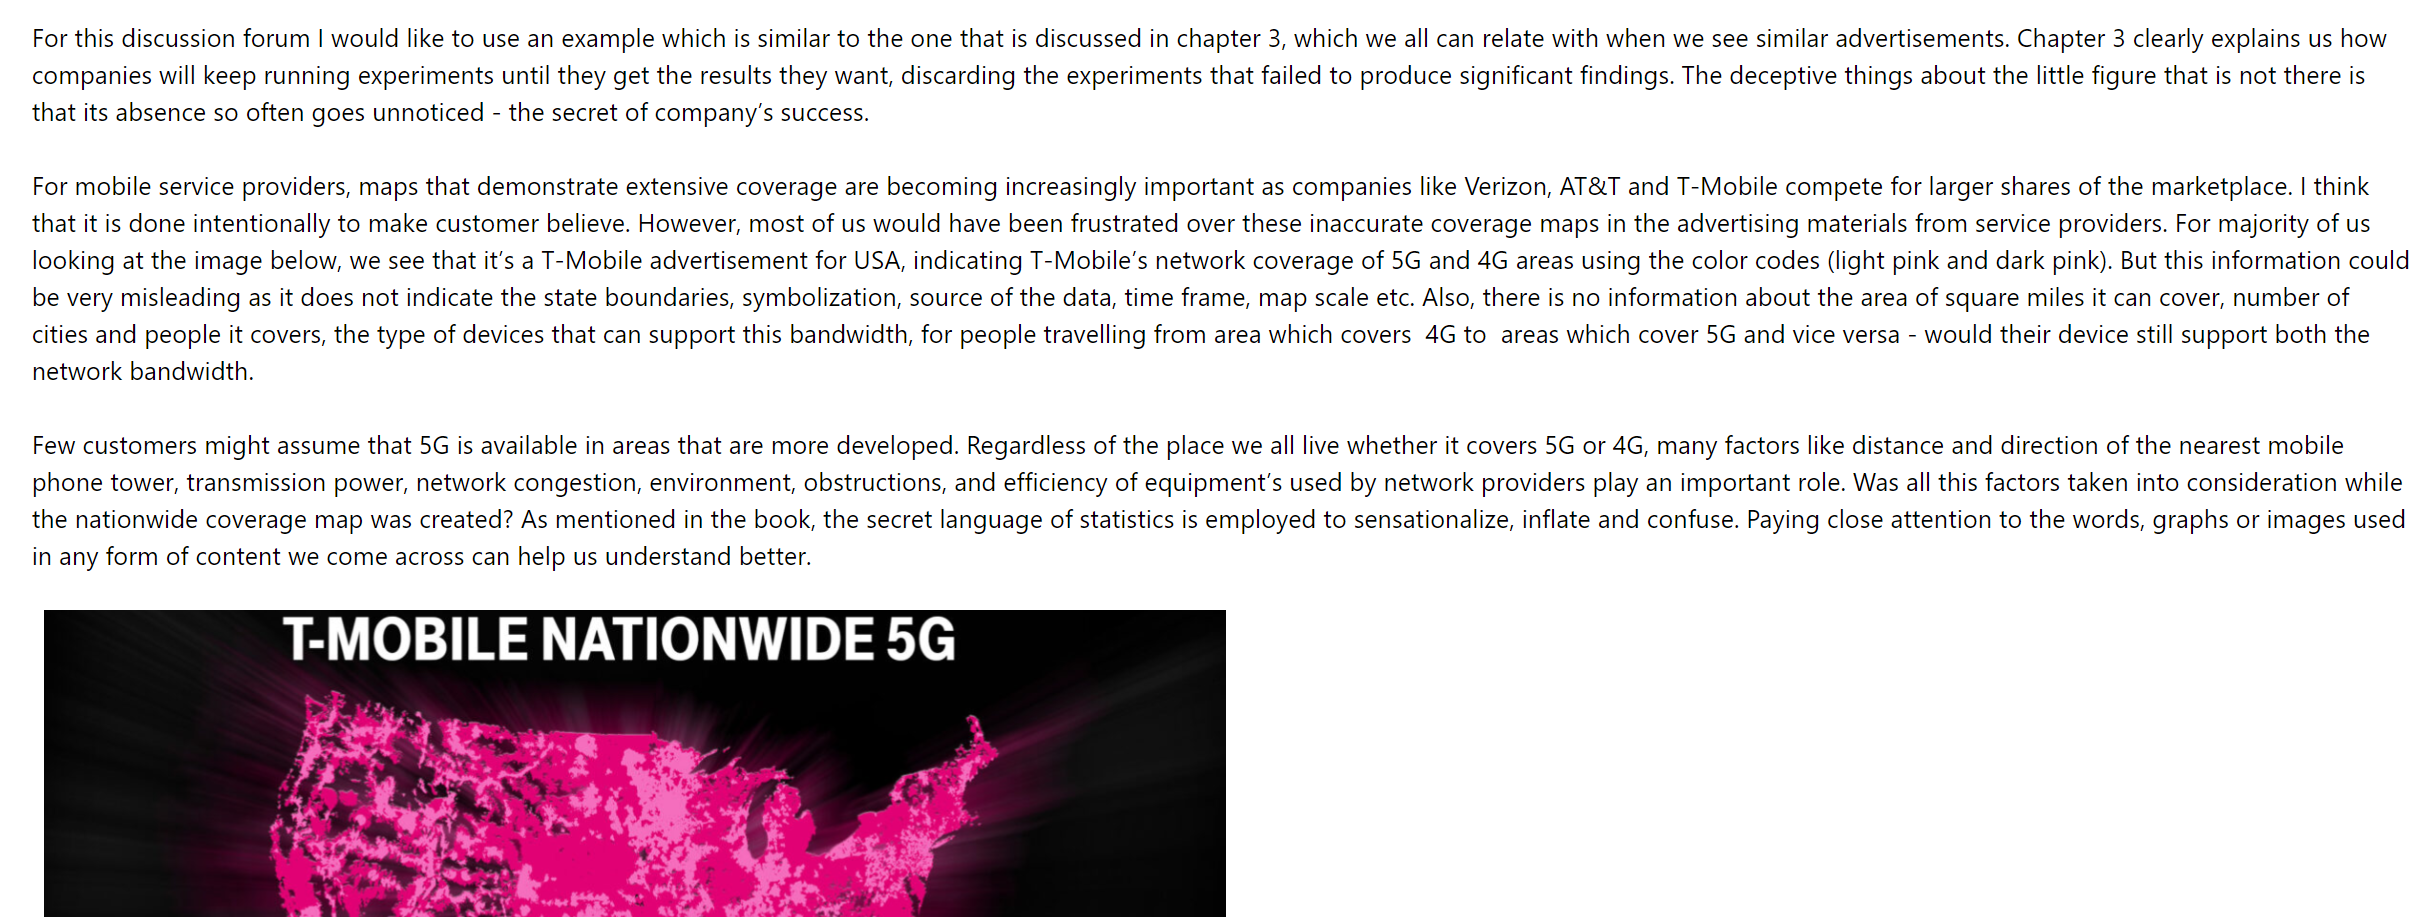
For this discussion forum I would like to use an example which is similar to the one that is discussed in chapter 3, which we all can relate with when we see similar advertisements. Chapter 3 clearly explains us how companies will keep running experiments until they get the results they want, discarding the experiments that failed to produce significant findings The deceptive things about the little figure that is not there is that its absence so often goes unnoticed - the secret of company's success. For mobile service providers, maps that demonstrate extensive coverage are becoming increasingly important as companies like Verizon, AT8LT and T-Mobile compete for larger shares of the marketplace. I think that it is done intentionally to make customer believe. However, most of us would have been frustrated over these inaccurate coverage maps in the advertising materials from service providers, For majority of us looking at the image below, we see that it's a T-Mobile advertisement for USA, indicating TvMobile's network coverage of 56 and AG areas using the color codes (light pink and dark pink). But this information could be very misleading as it does not indicate the state boundaries, symbolization, source of the data, time frame, map scale etc, Also, there is no information about the area of square miles it can cover, number of cities and people it covers, the type of devices that can support this bandwidth, for people travelling from area which covers 46 to areas which cover 56 and vice versa - would their device still support both the network bandwidth. Few customers might assume that 56 is available in areas that are more developed. Regardless of the place we all live whether it covers 56 or 46, many factors like distance and direction of the nearest mobile phone tower, transmission power, network congestion, environment, obstructions, and efficiency of equipment's used by network providers play an important role, Was all this factors taken into consideration while the nationwide coverage map was created? As mentioned in the book, the secret language of statistics is employed to sensationalize, inflate and confuse. Paying close attention to the words, graphs or images used in any form of content we come across can help us understand better. T-MOBILE NATIONWIDE 5G
Step by Step Solution
There are 3 Steps involved in it

Get step-by-step solutions from verified subject matter experts