

Question: I would like to put it in tabular form, but then I can't post because it says the question is too long. The primary measure
I would like to put it in tabular form, but then I can't post because it says the question is too long.
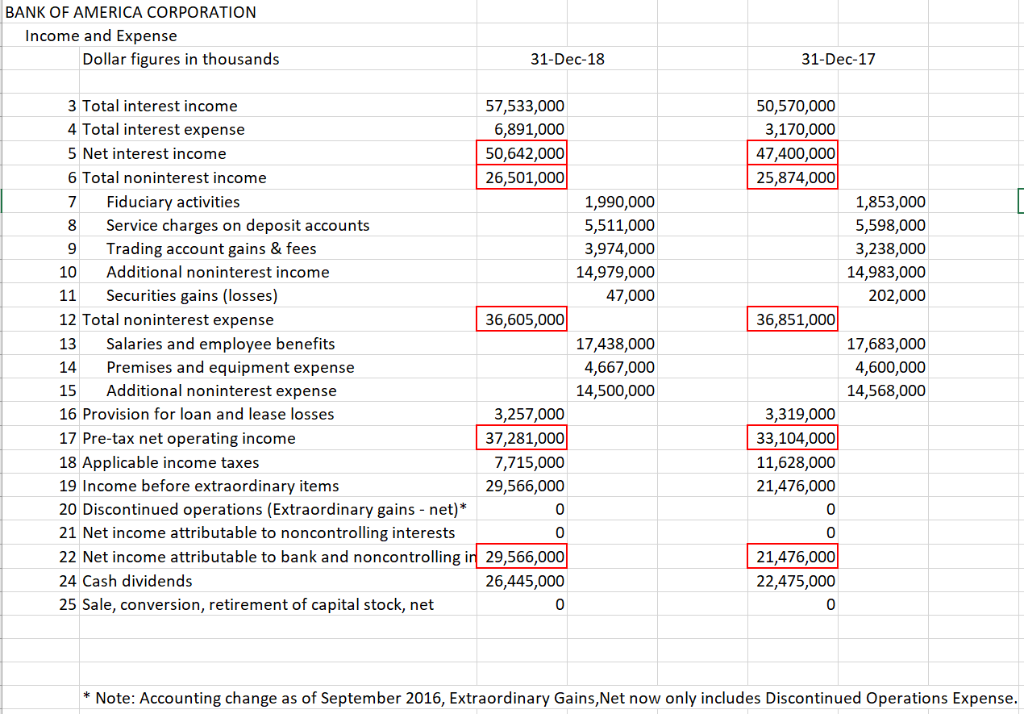
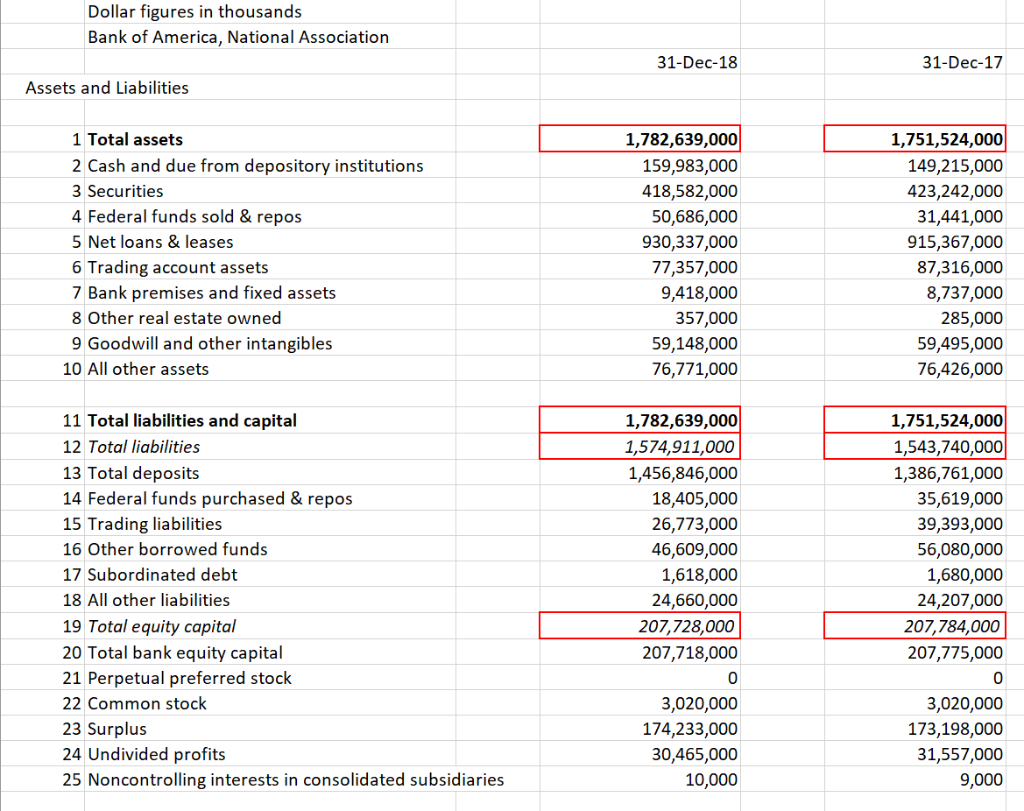
- The primary measure of performance for publicly held corporations is the return to shareholders. What has ROE been for the two years?
- A measure of how well a corporation utilizes its assets is its ROA. Compute this ratio for the two years. Did it improve or deteriorate?
- It appears that the ROE is larger than the ROA by a factor. That is, how many times larger is ROE than ROA? In your own words explain why ROE is so many times greater than ROA. (Use only 2018)
- Compute and compare the PROFIT MARGIN and ASSET UTILIZATION ratios for the two years.
- How do the ratios in Q4 above explain the ROA?
- Compute the INTEREST EXPENSE RATIO, provision for loan losses ratio, non interest expense ratio, and the tax ratio for 2018. Which of these ratios most negatively affected the profit margin in 2018?
- What are the INTEREST INCOME RATIO and the NONINTEREST INCOME RATIO for 2018 compared to 2017?
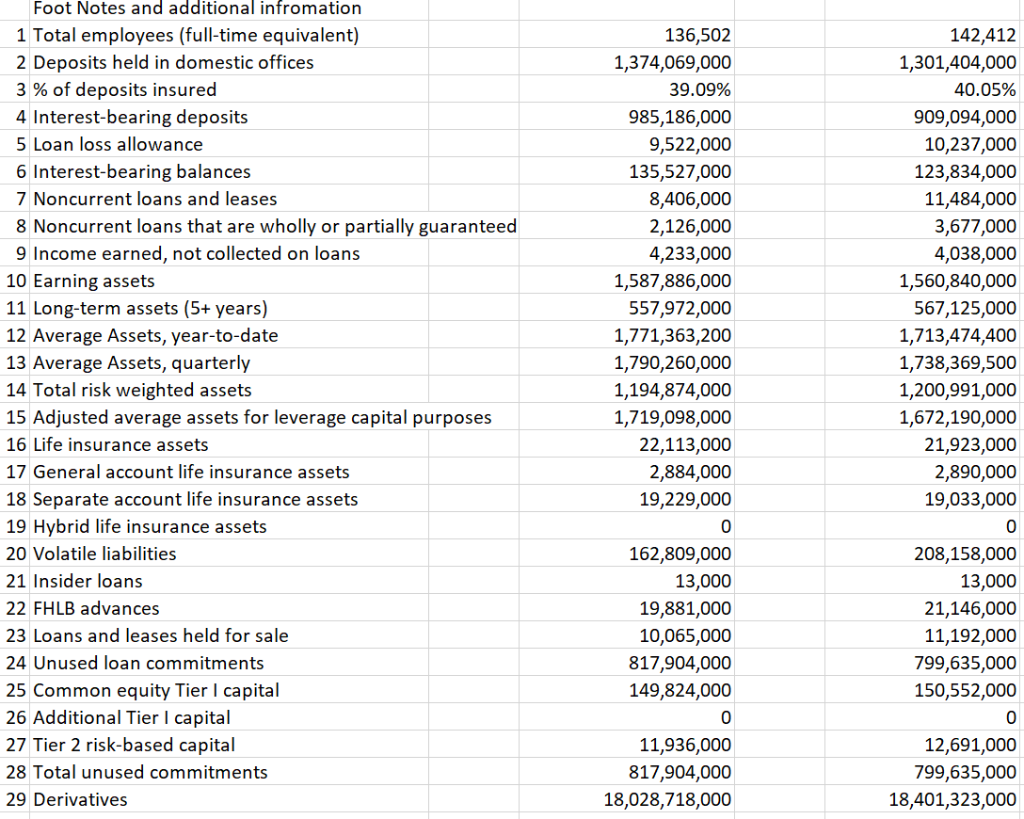
- Using the data provided in the footnotes of the balance sheet for 2018 compute:
-
- Common equity Tier I risk based ratio
- Tier I risk based ratio
- Total risk based ratio
- Tier I leverage ratio (for Total Exposure use Total Assets)
BANK OF AMERICA CORPORATION Income and Expense Dollar figures in thousands 31-Dec-17 31-Dec-18 3 Tota interest income 57,533,000 6,891,000 50,570,000 4 Total interest expense 3,170,000 50,642,000 47,400,000 5 Net interest income 6 Total noninterest income 26,501,000 25,874,000 7 Fiduciary activities Service charges on deposit accounts 1,990,000 5,511,000 1,853,000 8 5,598,000 3,974,000 3,238,000 9Trading account gains & fees 10 Additional noninterest income 14,979,000 47,000 14,983,000 202,000 11Securities gains (losses) 12 Total noninterest expense 13 Salaries and employee benefits 14Premises and equipment expense 15 Additional noninterest expense 36,605,000 36,851,000 17,438,000 17,683,000 4,600,000 4,667,000 14,500,000 14,568,000 16 Provision for loan and lease losses 3,257,000 3,319,000 37,281,000 17 Pre-tax net operating income 33,104,000 18 Applicable income taxes 7,715,000 11,628,000 19 Income before extraordinary items 20 Discontinued operations (Extraordinary gains net) 21 Net income attributable to noncontrolling interests 29,566,000 21,476,000 0 0 0 21,476,000 22 Net income attributable to bank and noncontrolling in 29,566,000 26,445,000 22,475,000 24 Cash dividends 25 Sale, conversion, retirement of capital stock, net 0 0 Note: Accounting change as of September 2016, Extraordinary Gains,Net now only includes Discontinued Operations Expense Dollar figures in thousands Bank of America, National Association 31-Dec-18 31-Dec-17 Assets and Liabilities 1 Total assets 1,782,639,000 1,751,524,000 2 Cash and due from depository institutions 159,983,000 149,215,000 418,582,000 50,686,000 423,242,000 31,441,000 3 Securities 4 Federal funds sold & repos 5 Net loans & leases 930,337,000 915,367,000 87,316,000 8,737,000 6 Trading account assets 77,357,000 9,418,000 7 Bank premises and fixed assets 8 Other real estate owned 357,000 285,000 9 Goodwill and other intangibles 59,148,000 59,495,000 76,771,000 10 All other assets 76,426,000 11 Total liabilities and capital 1,782,639,000 1,751,524,000 12 Total liabilities 1543,740,000 1,574,911,000 13 Total deposits 1,456,846,000 1,386,761,000 18,405,000 35,619,000 14 Federal funds purchased & repos 15 Trading liabilities 26,773,000 39,393,000 16 Other borrowed funds 56,080,000 46,609,000 1,618,000 24,660,000 17 Subordinated debt 1,680,000 18 All other liabilities 24,207,000 19 Total equity capital 207,728,000 207,784,000 20 Total bank equity capital 21 Perpetual preferred stock 207,718,000 207,775,000 0 0 22 Common stock 3,020,000 3,020,000 23 Surplus 24 Undivided profits 25 Noncontrolling interests in consolidated subsidiaries 174,233,000 173,198,000 31,557,000 30,465,000 9,000 10,000 Foot Notes and additional infromation 1 Total employees (full-time equivalent) 136,502 1,374,069,000 142,412 2 Deposits held in domestic offices 3 % of deposits insured 4 Interest-bearing deposits 1,301,404,000 39.09% 40.05% 985,186,000 9,522,000 135,527,000 909,094,000 10,237,000 5 Loan loss allowance 6 Interest-bearing balances 123,834,000 7 Noncurrent loans and leases 8,406,000 11,484,000 8 Noncurrent loans that are wholly or partially guaranteed 3,677,000 2,126,000 9 Income earned, not collected on loans 4,233,000 4,038,000 1,587,886,000 557,972,000 1,771,363,200 1,560,840,000 10 Earning assets 11 Long-term assets (5+ years) 567,125,000 1,713,474,400 12 Average Assets, year-to-date 13 Average Assets, quarterly 14 Total risk weighted assets 15 Adjusted average assets for leverage capital purposes 1,790,260,000 1,738,369,500 1,200,991,000 1,672,190,000 21,923,000 1,194,874,000 1,719,098,000 22,113,000 16 Life insurance assets 17 General account life insurance assets 2,884,000 19,229,000 2,890,000 18 Separate account life insurance assets 19,033,000 19 Hybrid life insurance assets 0 0 20 Volatile liabilities 162,809,000 208,158,000 21 Insider loans 13,000 13,000 22 FHLB advances 19,881,000 21,146,000 23 Loans and leases held for sale 11,192,000 799,635,000 150,552,000 10,065,000 24 Unused loan commitments 817,904,000 149,824,000 25 Common equity Tier I capital 26 Additional Tier I capital 27 Tier 2 risk-based capital 0 0 11,936,000 12,691,000 28 Total unused commitments 817,904,000 799,635,000 29 Derivatives 18,028,718,000 18,401,323,000 BANK OF AMERICA CORPORATION Income and Expense Dollar figures in thousands 31-Dec-17 31-Dec-18 3 Tota interest income 57,533,000 6,891,000 50,570,000 4 Total interest expense 3,170,000 50,642,000 47,400,000 5 Net interest income 6 Total noninterest income 26,501,000 25,874,000 7 Fiduciary activities Service charges on deposit accounts 1,990,000 5,511,000 1,853,000 8 5,598,000 3,974,000 3,238,000 9Trading account gains & fees 10 Additional noninterest income 14,979,000 47,000 14,983,000 202,000 11Securities gains (losses) 12 Total noninterest expense 13 Salaries and employee benefits 14Premises and equipment expense 15 Additional noninterest expense 36,605,000 36,851,000 17,438,000 17,683,000 4,600,000 4,667,000 14,500,000 14,568,000 16 Provision for loan and lease losses 3,257,000 3,319,000 37,281,000 17 Pre-tax net operating income 33,104,000 18 Applicable income taxes 7,715,000 11,628,000 19 Income before extraordinary items 20 Discontinued operations (Extraordinary gains net) 21 Net income attributable to noncontrolling interests 29,566,000 21,476,000 0 0 0 21,476,000 22 Net income attributable to bank and noncontrolling in 29,566,000 26,445,000 22,475,000 24 Cash dividends 25 Sale, conversion, retirement of capital stock, net 0 0 Note: Accounting change as of September 2016, Extraordinary Gains,Net now only includes Discontinued Operations Expense Dollar figures in thousands Bank of America, National Association 31-Dec-18 31-Dec-17 Assets and Liabilities 1 Total assets 1,782,639,000 1,751,524,000 2 Cash and due from depository institutions 159,983,000 149,215,000 418,582,000 50,686,000 423,242,000 31,441,000 3 Securities 4 Federal funds sold & repos 5 Net loans & leases 930,337,000 915,367,000 87,316,000 8,737,000 6 Trading account assets 77,357,000 9,418,000 7 Bank premises and fixed assets 8 Other real estate owned 357,000 285,000 9 Goodwill and other intangibles 59,148,000 59,495,000 76,771,000 10 All other assets 76,426,000 11 Total liabilities and capital 1,782,639,000 1,751,524,000 12 Total liabilities 1543,740,000 1,574,911,000 13 Total deposits 1,456,846,000 1,386,761,000 18,405,000 35,619,000 14 Federal funds purchased & repos 15 Trading liabilities 26,773,000 39,393,000 16 Other borrowed funds 56,080,000 46,609,000 1,618,000 24,660,000 17 Subordinated debt 1,680,000 18 All other liabilities 24,207,000 19 Total equity capital 207,728,000 207,784,000 20 Total bank equity capital 21 Perpetual preferred stock 207,718,000 207,775,000 0 0 22 Common stock 3,020,000 3,020,000 23 Surplus 24 Undivided profits 25 Noncontrolling interests in consolidated subsidiaries 174,233,000 173,198,000 31,557,000 30,465,000 9,000 10,000 Foot Notes and additional infromation 1 Total employees (full-time equivalent) 136,502 1,374,069,000 142,412 2 Deposits held in domestic offices 3 % of deposits insured 4 Interest-bearing deposits 1,301,404,000 39.09% 40.05% 985,186,000 9,522,000 135,527,000 909,094,000 10,237,000 5 Loan loss allowance 6 Interest-bearing balances 123,834,000 7 Noncurrent loans and leases 8,406,000 11,484,000 8 Noncurrent loans that are wholly or partially guaranteed 3,677,000 2,126,000 9 Income earned, not collected on loans 4,233,000 4,038,000 1,587,886,000 557,972,000 1,771,363,200 1,560,840,000 10 Earning assets 11 Long-term assets (5+ years) 567,125,000 1,713,474,400 12 Average Assets, year-to-date 13 Average Assets, quarterly 14 Total risk weighted assets 15 Adjusted average assets for leverage capital purposes 1,790,260,000 1,738,369,500 1,200,991,000 1,672,190,000 21,923,000 1,194,874,000 1,719,098,000 22,113,000 16 Life insurance assets 17 General account life insurance assets 2,884,000 19,229,000 2,890,000 18 Separate account life insurance assets 19,033,000 19 Hybrid life insurance assets 0 0 20 Volatile liabilities 162,809,000 208,158,000 21 Insider loans 13,000 13,000 22 FHLB advances 19,881,000 21,146,000 23 Loans and leases held for sale 11,192,000 799,635,000 150,552,000 10,065,000 24 Unused loan commitments 817,904,000 149,824,000 25 Common equity Tier I capital 26 Additional Tier I capital 27 Tier 2 risk-based capital 0 0 11,936,000 12,691,000 28 Total unused commitments 817,904,000 799,635,000 29 Derivatives 18,028,718,000 18,401,323,000
Step by Step Solution
There are 3 Steps involved in it

Get step-by-step solutions from verified subject matter experts