

Question: I would like to see the Work for this Question please #6 This Question: 4 pts 6 of 16 This Test: 100 pts possible The
I would like to see the Work for this Question please #6
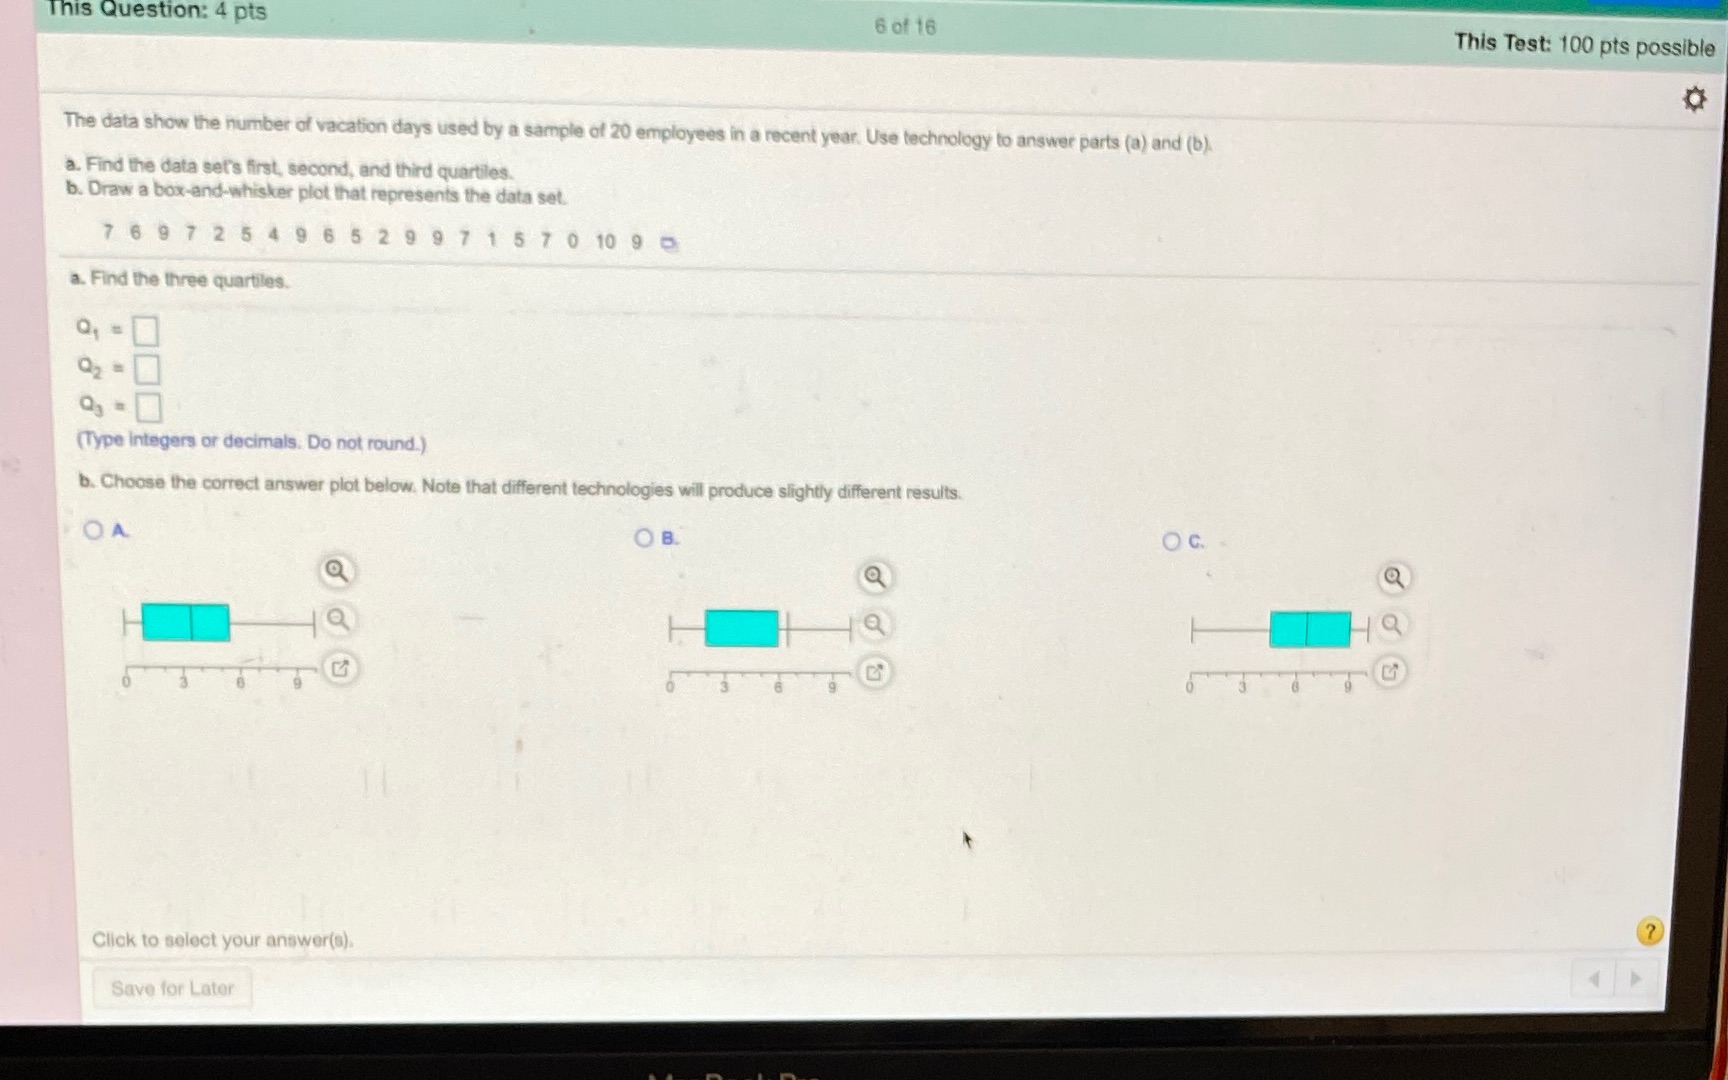
This Question: 4 pts 6 of 16 This Test: 100 pts possible The data show the number of vacation days used by a sample of 20 employees in a recent year. Use technology to answer parts (a) and (b). a. Find the data set's first, second, and third quartiles. b. Draw a box-and-whisker plot that represents the data set. 7697 25 4 9 6 5 2 9 9 7 1 5 7 0 10 9 0 a. Find the three quartiles. (Type integers or decimals. Do not round.) b. Choose the correct answer plot below. Note that different technologies will produce slightly different results. OA O B. Oc. Q Q Q (? Click to select your answer(s) Save for Later
Step by Step Solution
There are 3 Steps involved in it

Get step-by-step solutions from verified subject matter experts