

Question: I wrote this Python code and the graph won't display. I can see the box for the graph but nothing is graphed. I tried to
I wrote this Python code and the graph won't display. I can see the box for the graph but nothing is graphed. I tried to convert to an array but still no results. Please help.
My code is :
import math
import matplotlib.pyplot as plt
import numpy as np
j = np.arange(.1,1)
k = np.asarray(j)
a = math.sqrt((0.02358/k)-0.0189)
b = -(0.054)*50*math.exp(-0.054*50)
c = (50*a*math.cos(50*a))+math.sin(50*a)
d = math.exp(-0.054*50)
e = math.sin(50*a)
determinant = (b*e)-(c*d)
plt.plot(k, determinant)
plt.xlim([0,1])
plt.ylim([-5,5])
plt.xlabel('k value')
plt.ylabel('Determinant')
plt.show()
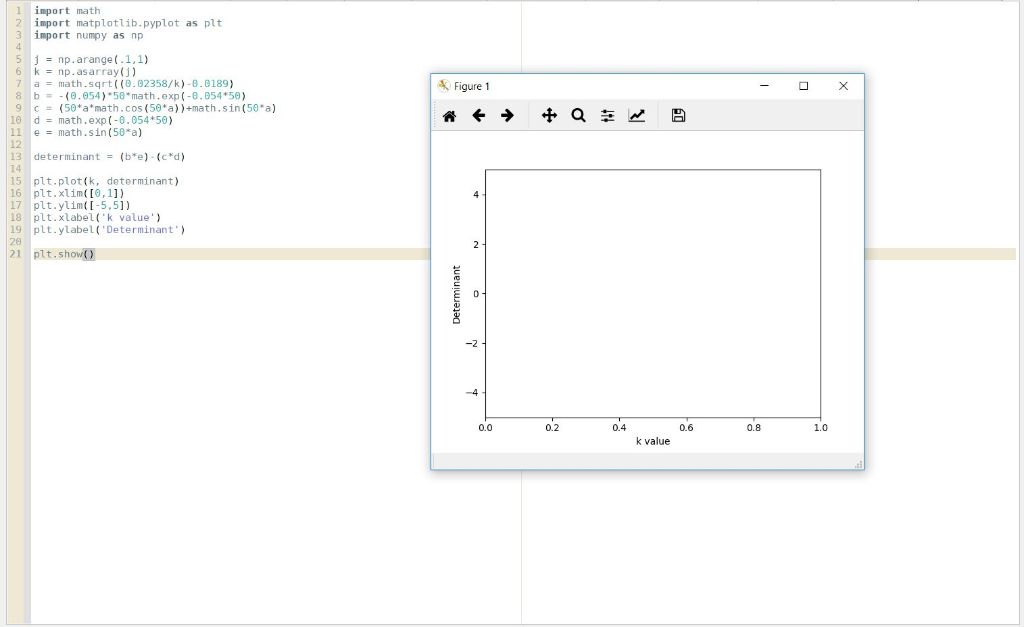
1 import math 2 import matplotlib.pyplot as plt 3 import numpy as np 5 np.arange(.1,1) Figure 1 7 amath.sqrt ((0.02358/k)-8.0189) 8 b -(0.954)"58"math, exp (-8.854*50) 9 C-(50 a math.cos (50 a))+math.sin (50 a) 10 d math.exp -0.054 50) 11 e math.sin (50*a) 12 13 i determinant (b"e)-(c*d) 14 15 plt.plot (k, determinant) 16 plt.xlim(I0,1]) 17 plt.ylim -5,51) 18 plt.xlabel'k value) 19 plt.ylabel'Determinant' 20 21 plt.show) 0.0 0.2 0.4 0.6 0.8 1.0 k value
Step by Step Solution
There are 3 Steps involved in it

Get step-by-step solutions from verified subject matter experts