

IAQ -Indoor Air Quality Data. In the graph, you can see 2 lines. The carbon Monoxide Ave
Question:
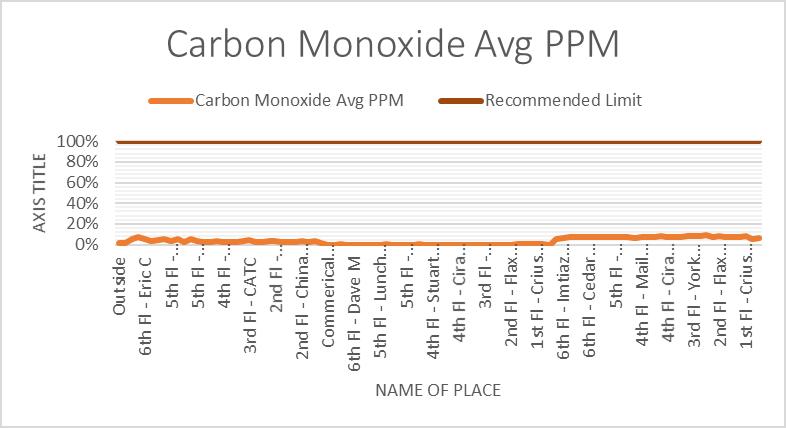
IAQ -Indoor Air Quality Data. In the graph, you can see 2 lines. The carbon Monoxide Ave PPM and the other line is the Recommended limit. Can you try to analyze the graph by comparing the two lines weather its above or below the recommended limit or did it exceed the recommended guidelines level? and what other analyses or interpretations can you give? after giving the interpretation, what can you recommend? like recommendation.
References: carbon monoxide guidelines based on ASHRAE, Health Canada ASTER, WHO, Ontario Reg833/90 & ACGIH TLV
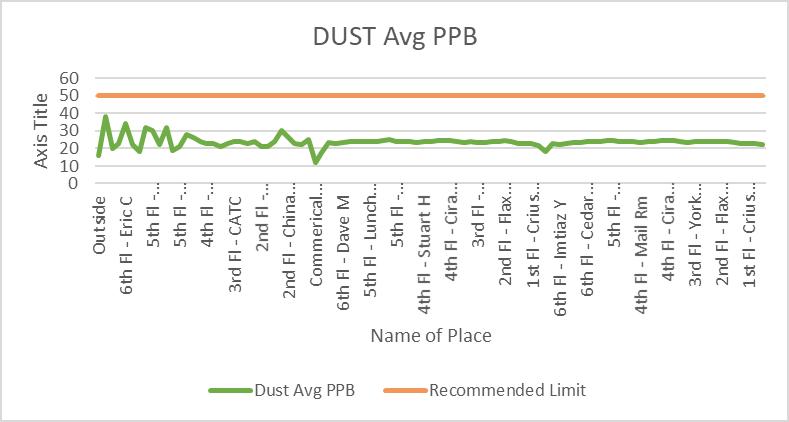
1. can you try to give your interpretation to this graph - Dust Avg PPB. analize the graph by comparing the two lines. one line which is the dust Avg PPB and the other line is the recommended limit. what is your interpretation, how did you analize or what can you say about the graph. what is you recommendation regarding this graph. This are all based on the Indoor Air Quality at workplace.
References and Guidelines regarding topic and finding the recommended
Expert Answer:
Interpretation of Carbon Monoxide Graph The presented graph illustrates Carbon Monoxide Avg PPM parts per million across different locations compared ... View the full answer


Income Tax Fundamentals 2013
ISBN: 9781285586618
31st Edition
Authors: Gerald E. Whittenburg, Martha Altus Buller, Steven L Gill
