

Question: 1. Analysis dividend and stock price history. 2. Using stock return analysis , show shareholders return over 1-10 years. Prepare chart explaining stock return for
1. Analysis dividend and stock price history.
2. Using stock return analysis , show shareholders’ return over 1-10 years. Prepare chart explaining stock return for holding period of 1,2,….,10 years.
3. Use XIRR function of xls for this purpose. Consider that an investor invested in Google at the beginning of Aug 2010. Data can be sourced from
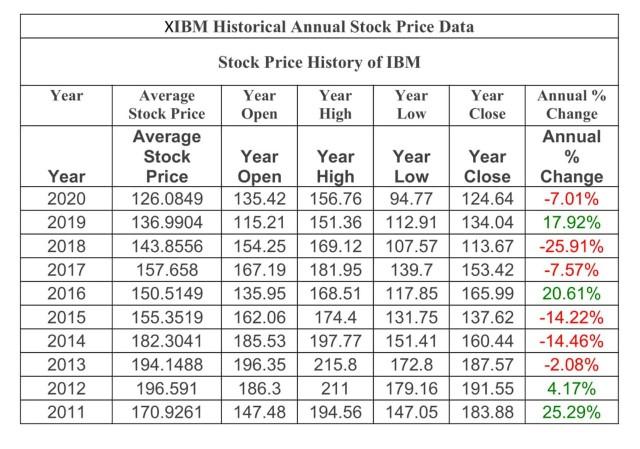
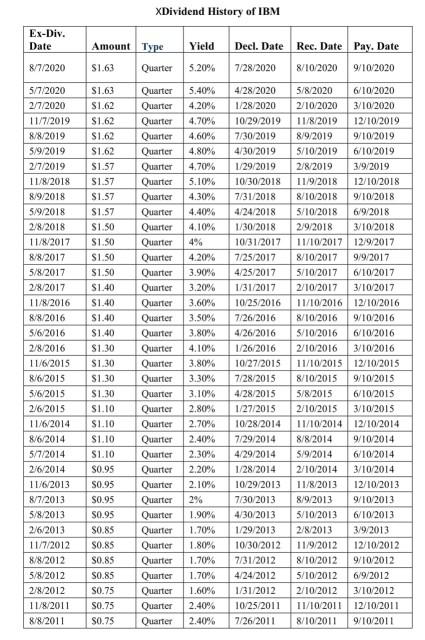
Year Year 2020 2019 2018 2017 2016 2015 2014 2013 2012 2011 XIBM Historical Annual Stock Price Data Stock Price History of IBM Year High Average Stock Price Year Open Year Low Year Open 135.42 Year Close Average Year Year Year Stock Price High Low Close 126.0849 156.76 94.77 124.64 136.9904 115.21 151.36 112.91 134.04 143.8556 154.25 169.12 107.57 113.67 157.658 167.19 181.95 139.7 153.42 150.5149 135.95 168.51 117.85 165.99 155.3519 162.06 174.4 131.75 137.62 182.3041 185.53 197.77 151.41 160.44 194.1488 196.35 215.8 172.8 187.57 179.16 191.55 196.591 186.3 211 170.9261 147.48 194.56 147.05 183.88 Annual% Change Annual % Change -7.01% 17.92% -25.91% -7.57% 20.61% -14.22% -14.46% -2.08% 4.17% 25.29% Ex-Div. Date Amount Type Yield Decl. Date $1.63 Quarter 5.20% 7/28/2020 $1.63 Quarter 5.40% 4/28/2020 $1.62 Quarter 4.20% 1/28/2020 11/7/2019 $1.62 Quarter 4.70% 10/29/2019 8/8/2019 $1.62 Quarter 4.60% 7/30/2019 8/9/2019 $1.62 Quarter 4.80% 4/30/2019 5/10/2019 $1.57 Quarter 4.70% 1/29/2019 2/8/2019 11/8/2018 $1.57 Quarter 5.10% 8/9/2018 $1.57 5/9/2018 2/8/2018 8/7/2020 5/7/2020 2/7/2020 5/9/2019 2/7/2019 XDividend History of IBM $1.57 Quarter 4.40% $1.50 4.10% 11/8/2017 $1.50 8/8/2017 5/8/2017 2/8/2017 11/8/2016 8/8/2016 5/6/2016 2/8/2016 11/6/2015 $1.30 8/6/2015 $1.30 5/6/2015 $1.30 2/6/2015 $1.10 11/6/2014 $1.10 Quarter Quarter 4% $1.50 Quarter 4.20% $1.50 Quarter 3.90% $1.40 Quarter 3.20% $1.40 Quarter 3.60% $1.40 Quarter 3.50% $1.40 Quarter 3.80% $1.30 Quarter 4.10% Quarter 3.80% Quarter 3.30% 8/6/2014 5/7/2014 2/6/2014 $0.95 11/6/2013 $0.95 9/10/2019 6/10/2019 3/9/2019 10/30/2018 11/9/2018 12/10/2018 Quarter 4.30% 7/31/2018 8/10/2018 9/10/2018 4/24/2018 5/10/2018 6/9/2018 1/30/2018 2/9/2018 3/10/2018 10/31/2017 11/10/2017 12/9/2017 7/25/2017 8/10/2017 9/9/2017 4/25/2017 5/10/2017 6/10/2017 2/10/2017 8/7/2013 5/8/2013 $0.95 $0.85 2/6/2013 11/7/2012 $0.85 8/8/2012 $0.85 5/8/2012 $0.85 2/8/2012 $0.75 11/8/2011 $0.75 8/8/2011 $0.75 $0.95 Quarter 2% 7/26/2016 8/10/2016 9/10/2016 4/26/2016 5/10/2016 6/10/2016 1/26/2016 2/10/2016 3/10/2016 10/27/2015 11/10/2015 12/10/2015 7/28/2015 8/10/2015 9/10/2015 Quarter 3.10% 4/28/2015 Quarter 2.80% 1/27/2015 Quarter 2.70% 10/28/2014 7/29/2014 8/8/2014 $1.10 Quarter 2.40% $1.10 Quarter 2.30% 4/29/2014 5/9/2014 Quarter 2,20% 1/28/2014 Quarter 2.10% 10/29/2013 Rec. Date Pay. Date 8/10/2020 9/10/2020 5/8/2020 2/10/2020 11/8/2019 1/31/2017 10/25/2016 Quarter 1.90% Quarter 1.70% Quarter 1.80% Quarter 1.70% Quarter 1.70% Quarter 1.60% Quarter 2.40% Quarter 2.40% 6/10/2020 3/10/2020 12/10/2019 3/10/2017 11/10/2016 12/10/2016 5/8/2015 2/10/2015 11/10/2014 6/10/2015 3/10/2015 12/10/2014 9/10/2014 6/10/2014 2/10/2014 3/10/2014 11/8/2013 12/10/2013 7/30/2013 8/9/2013 9/10/2013 4/30/2013 5/10/2013 6/10/2013 3/9/2013 1/29/2013 2/8/2013 10/30/2012 11/9/2012 7/31/2012 8/10/2012 4/24/2012 1/31/2012 3/10/2012 10/25/2011 12/10/2011 7/26/2011 8/10/2011 9/10/2011 12/10/2012 9/10/2012 5/10/2012 6/9/2012 2/10/2012 11/10/2011
Step by Step Solution
3.34 Rating (163 Votes )
There are 3 Steps involved in it
answer1question In analysis of prices and historical yields of the sh... View full answer

Get step-by-step solutions from verified subject matter experts