

Question: ictive Assignment 65% (6 for Section 2.1 Introduction Objective 1 Objective 2 Objective 3 tive 2: Construct Bar Graphs rganizing Qualitative Data 1.RA-8 0 of
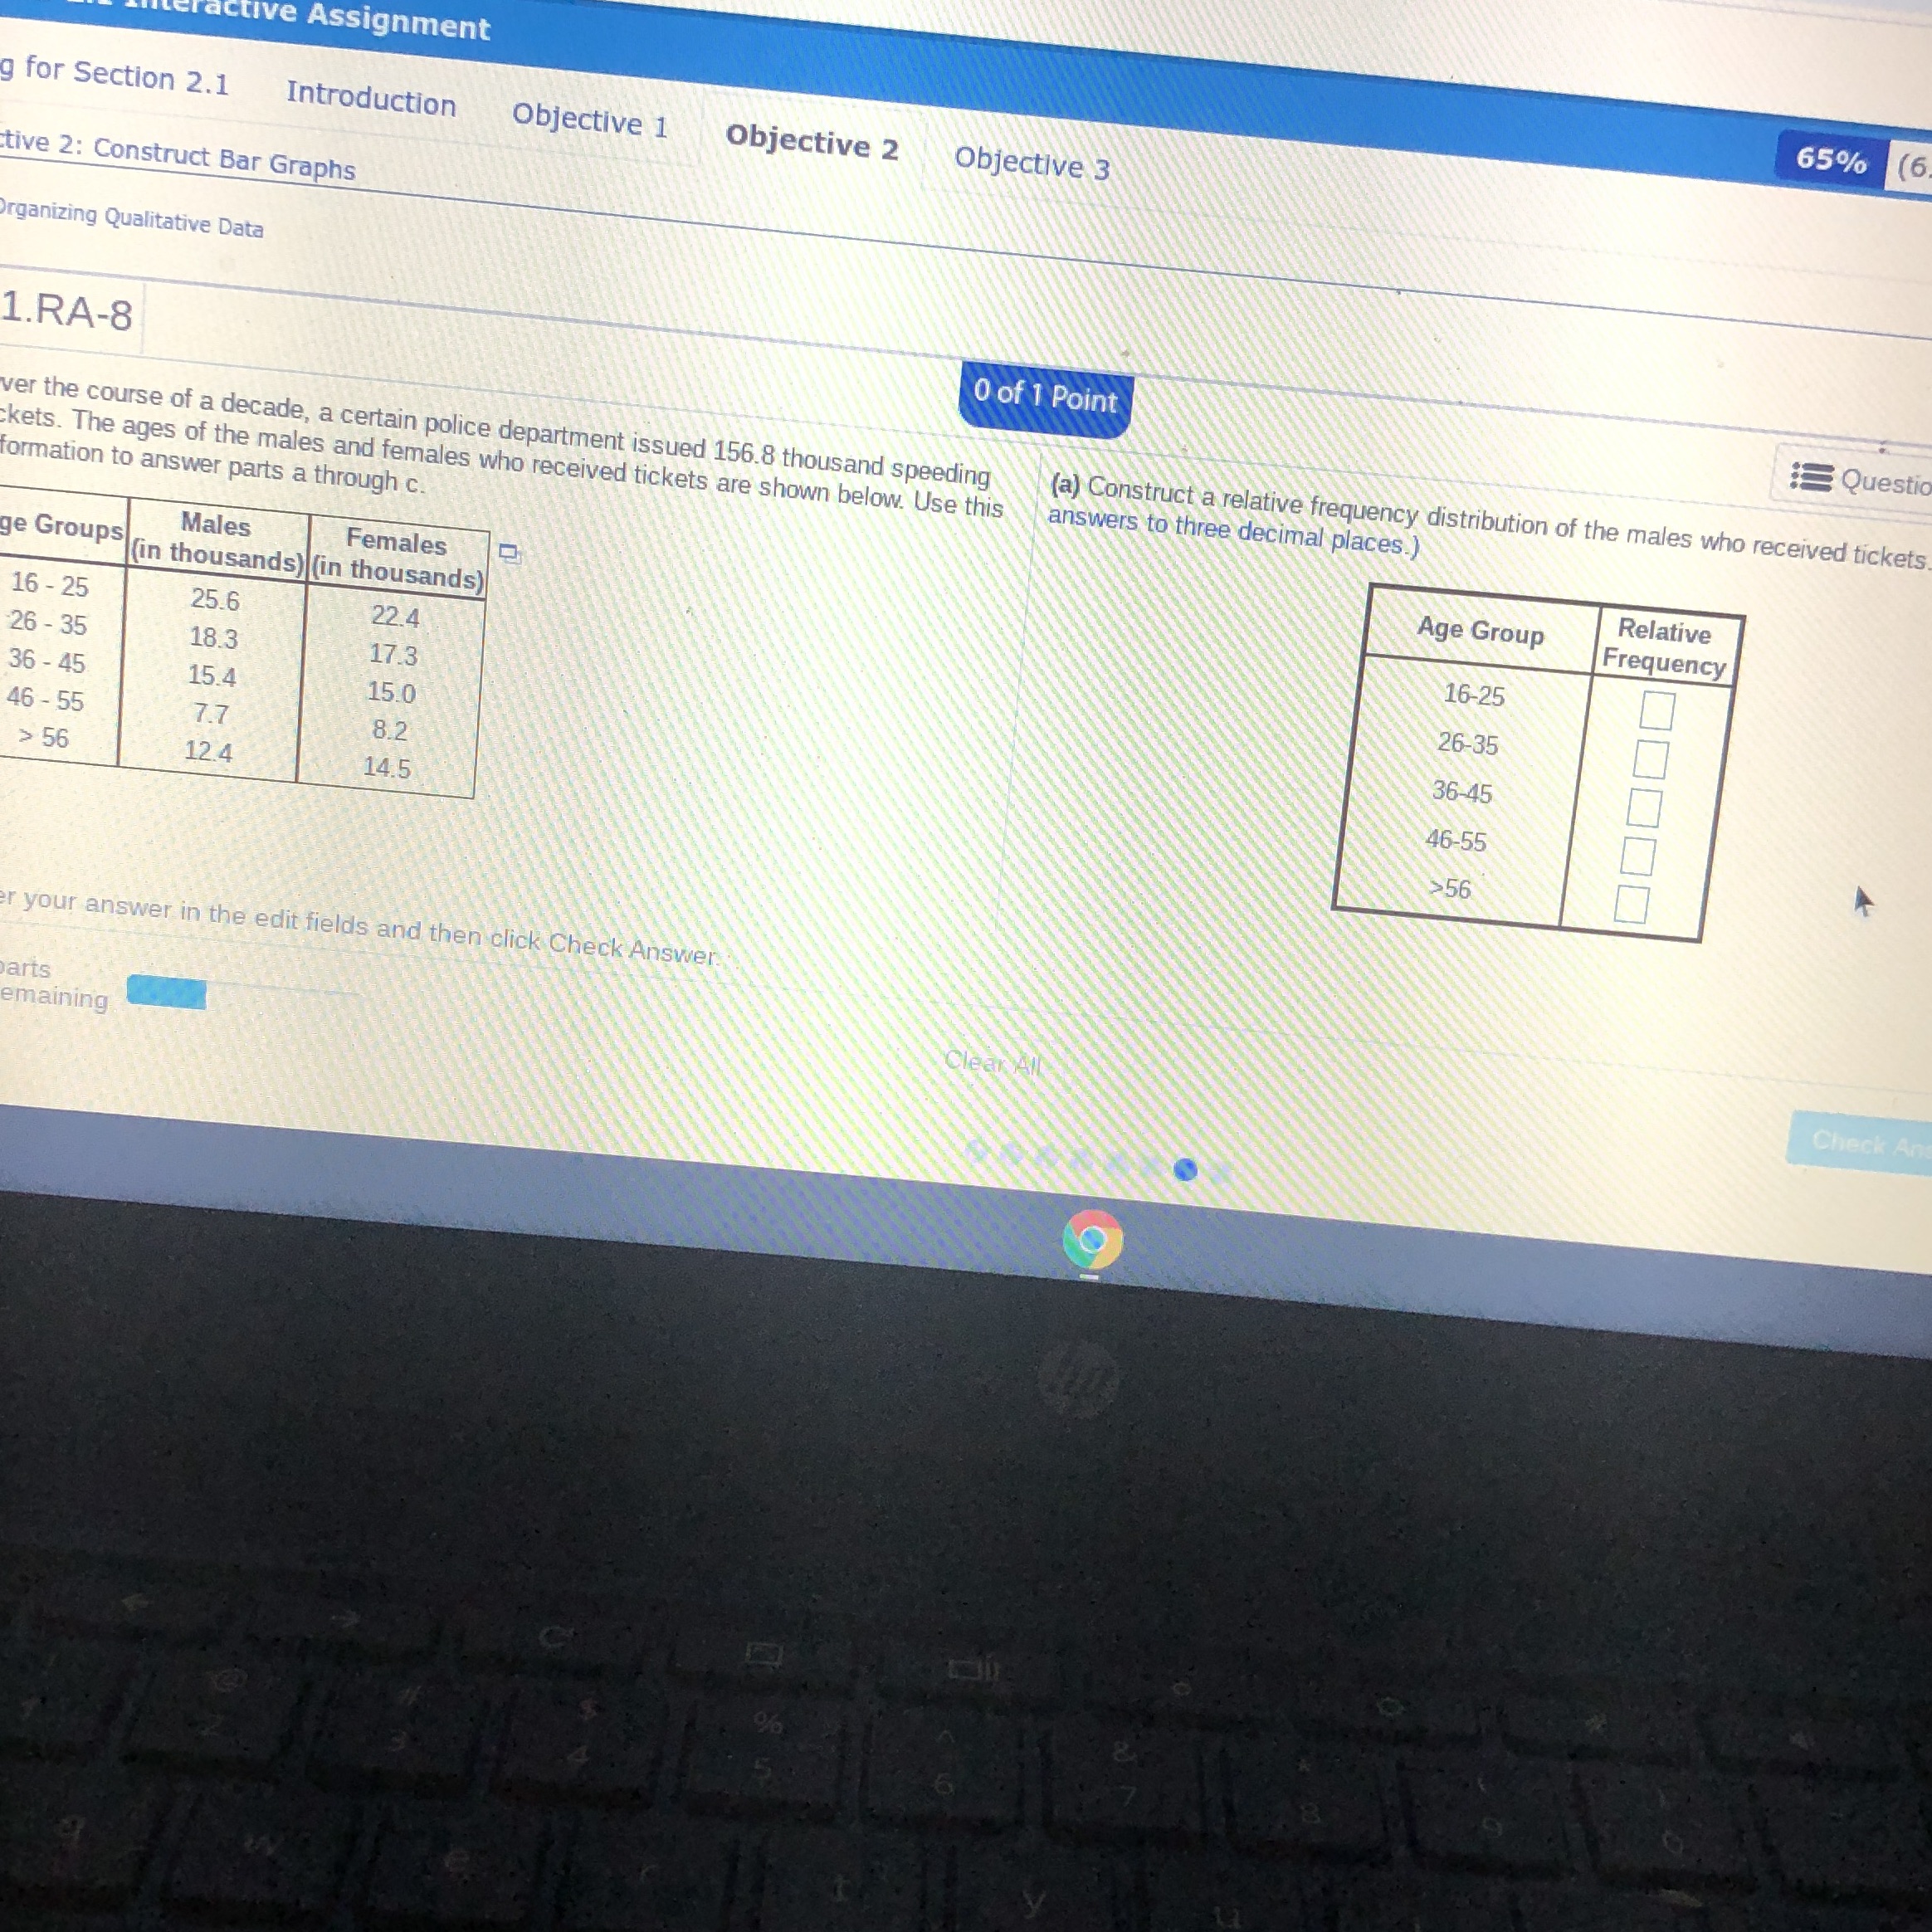
ictive Assignment 65% (6 for Section 2.1 Introduction Objective 1 Objective 2 Objective 3 tive 2: Construct Bar Graphs rganizing Qualitative Data 1.RA-8 0 of 1 Point Questi ver the course of a decade, a certain police department issued 156.8 thousand speeding (a) Construct a relative frequency distribution of the males who received tickets ckets. The ages of the males and females who received tickets are shown below. Use this answers to three decimal places.) formation to answer parts a through c. Males Females Age Group Relative ge Groups Frequency (in thousands) (in thousands) 16 - 25 25.6 22.4 16-25 26 - 35 18.3 17.3 26-35 36 - 45 15.4 15.0 36-45 46 -55 7.7 8.2 46-55 56 12.4 145 >56 your answer in the edit fields and then click Check Answer arts emaining 9
Step by Step Solution
There are 3 Steps involved in it

Get step-by-step solutions from verified subject matter experts