

Question: iData Table copy its contents into a spreadsheet ABC Returns XYZ Returns Year 2005 2006 2007 2008 2009 2010 2011 2012 2013 2014 1.5% -31.5%
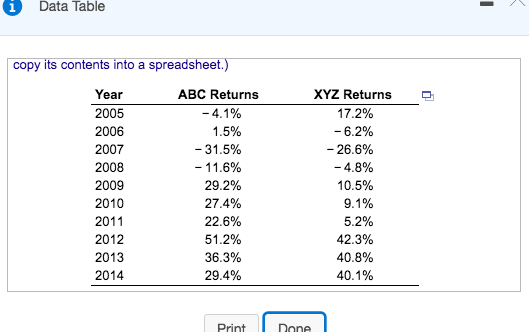
iData Table copy its contents into a spreadsheet ABC Returns XYZ Returns Year 2005 2006 2007 2008 2009 2010 2011 2012 2013 2014 1.5% -31.5% -1 1 .6% 29.2% 274% 22.6% 51.2% 36.3% 29.4% 17.2% -6.2% -26.6% -4.8% 10.5% 9.1% 5.2% 423% 40.8% 40.1 % Print none The following table, EEB.contains annual returns for the stocks of ABC Corp. (ABC) and XYZ Corp. (XYZ). The returns are calculated using end-of-year prices (adjusted for dividends and stock splits) retrieved from http://www.finance.yahoo.com/. Use the information to create an Excel spreadsheet that calculates the correlation coefficient for ABC and XYZ annual returns. (Hint: Review the Excel screenshot on page 174.) The correlation coefficient is(Round to five decimal places.)
Step by Step Solution
There are 3 Steps involved in it

Get step-by-step solutions from verified subject matter experts