

Question: identify and describe the following key elements: Background and need for the study. Statement of the problem being studied. Research questions or hypotheses. Research method/design.
- identify and describe the following key elements:
- Background and need for the study.
- Statement of the problem being studied.
- Research questions or hypotheses.
- Research method/design.
- Population, sample, and participants.
- brief summary of the article describing,1) the reason the study was conducted, 2) the key methods, 3) the main results, 4) the authors' interpretation of the results, 5) a summary of the author's discussion, and 6) your interpretation ofand the main results.Include an interpretation and discussion of the results.
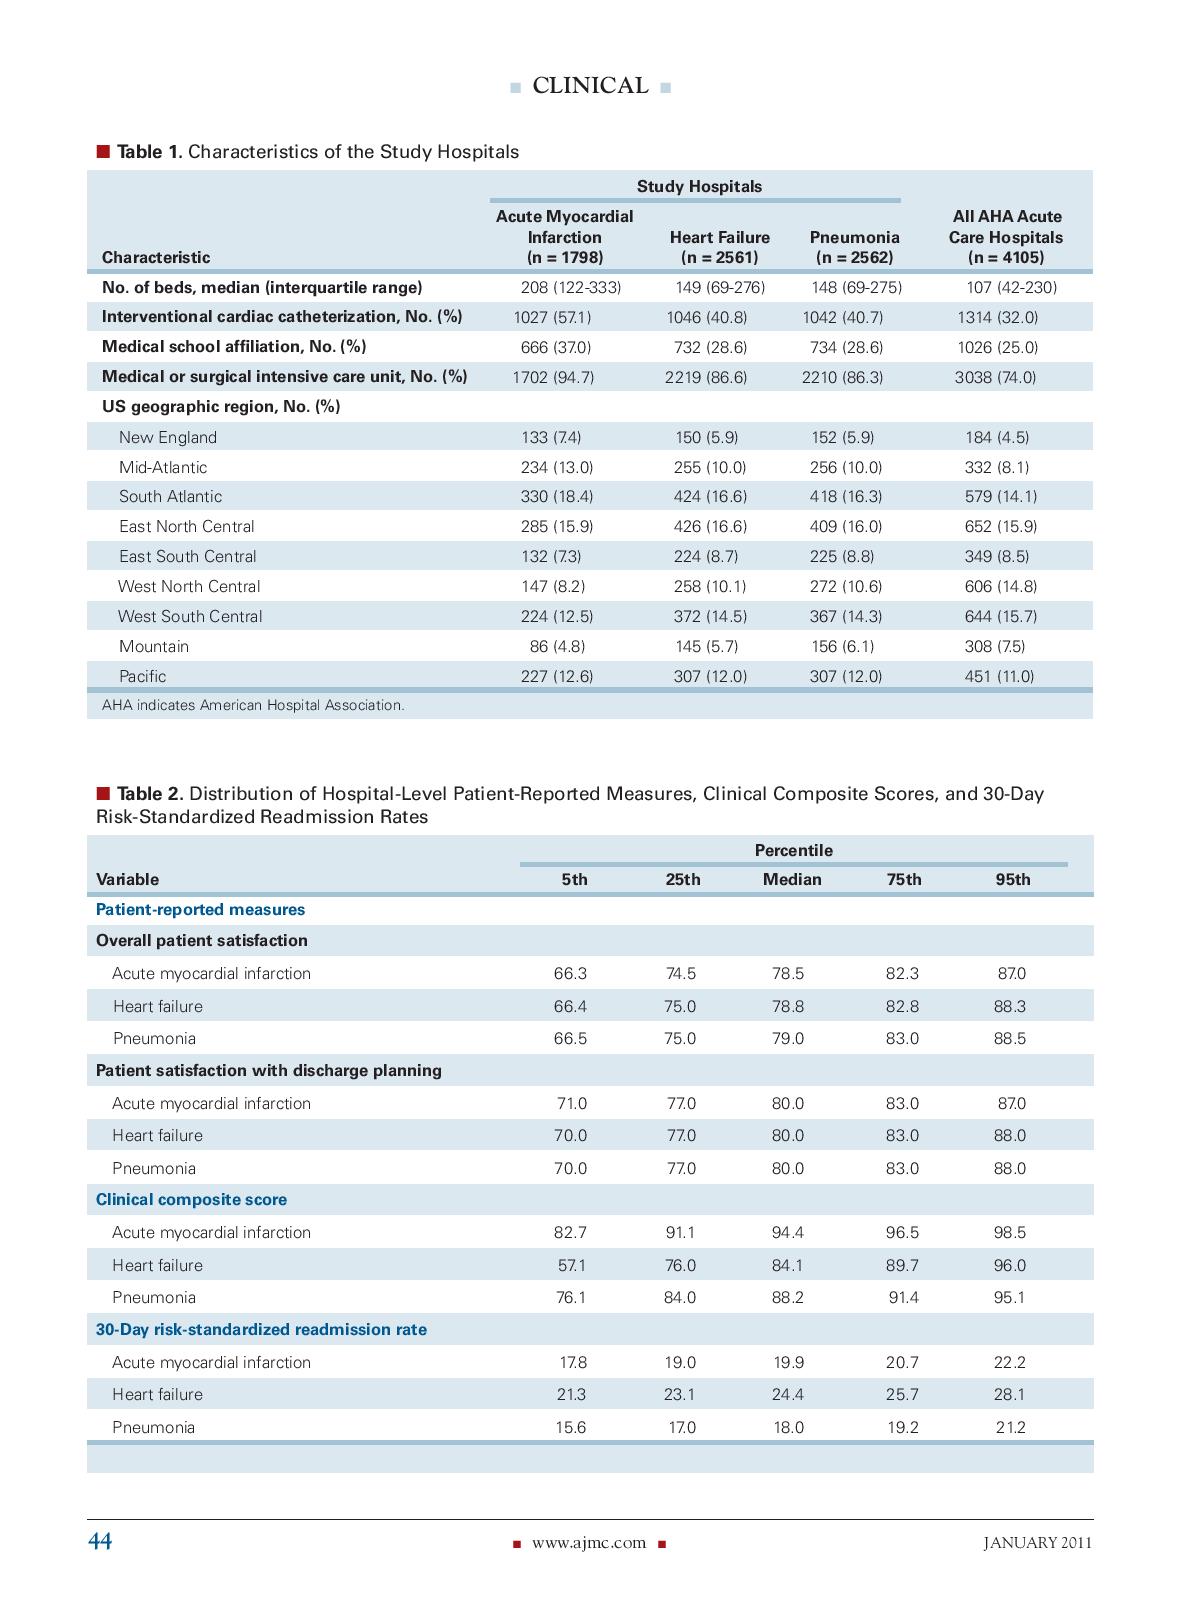
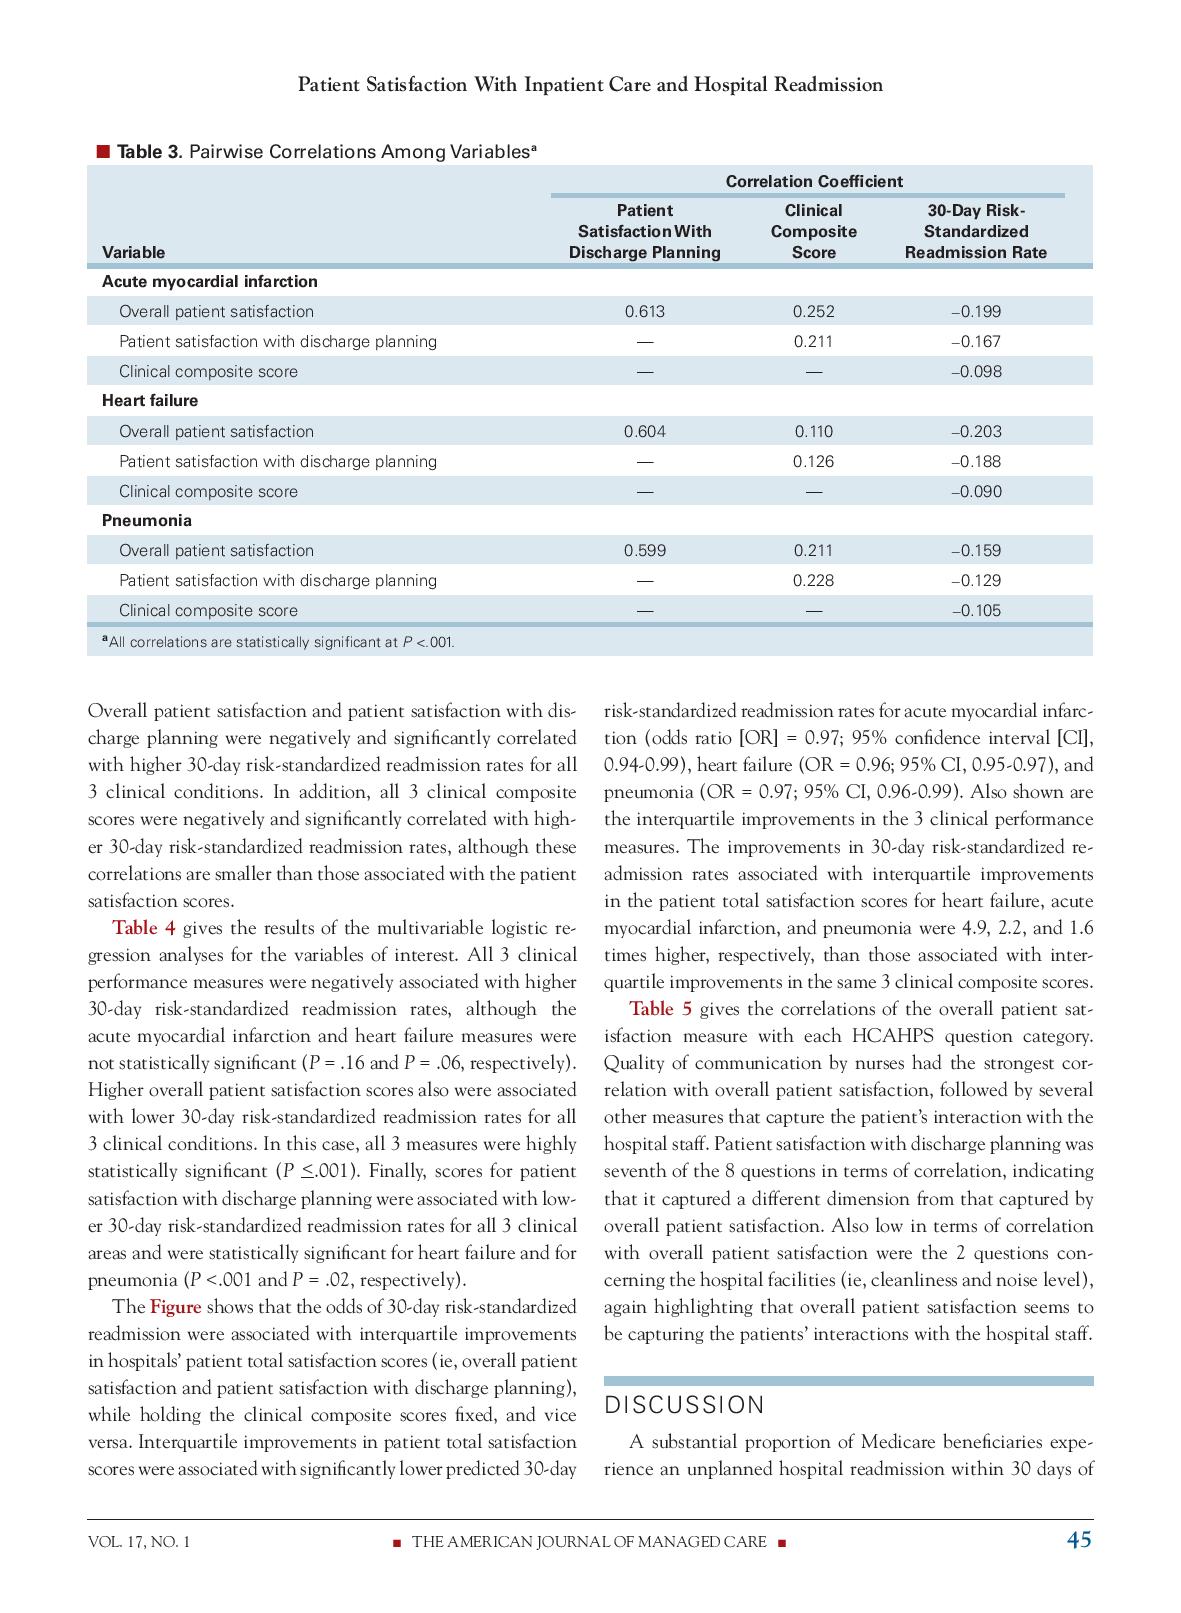
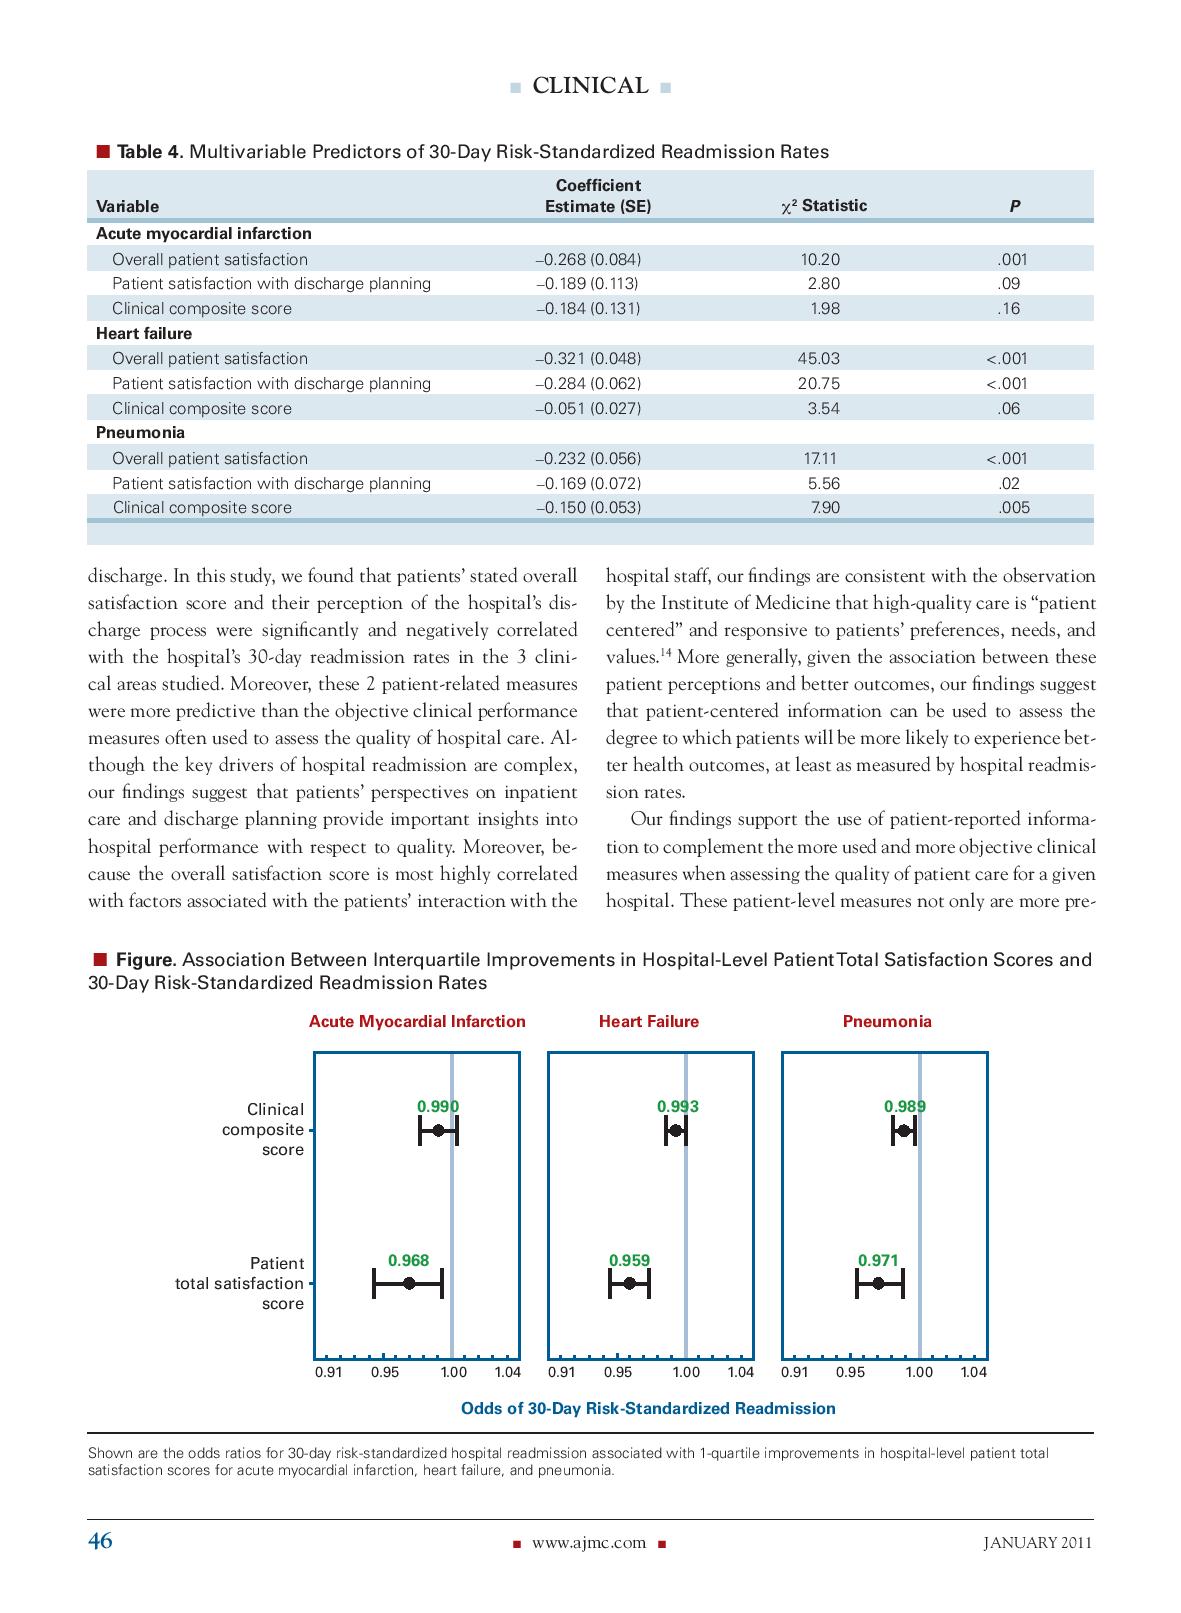
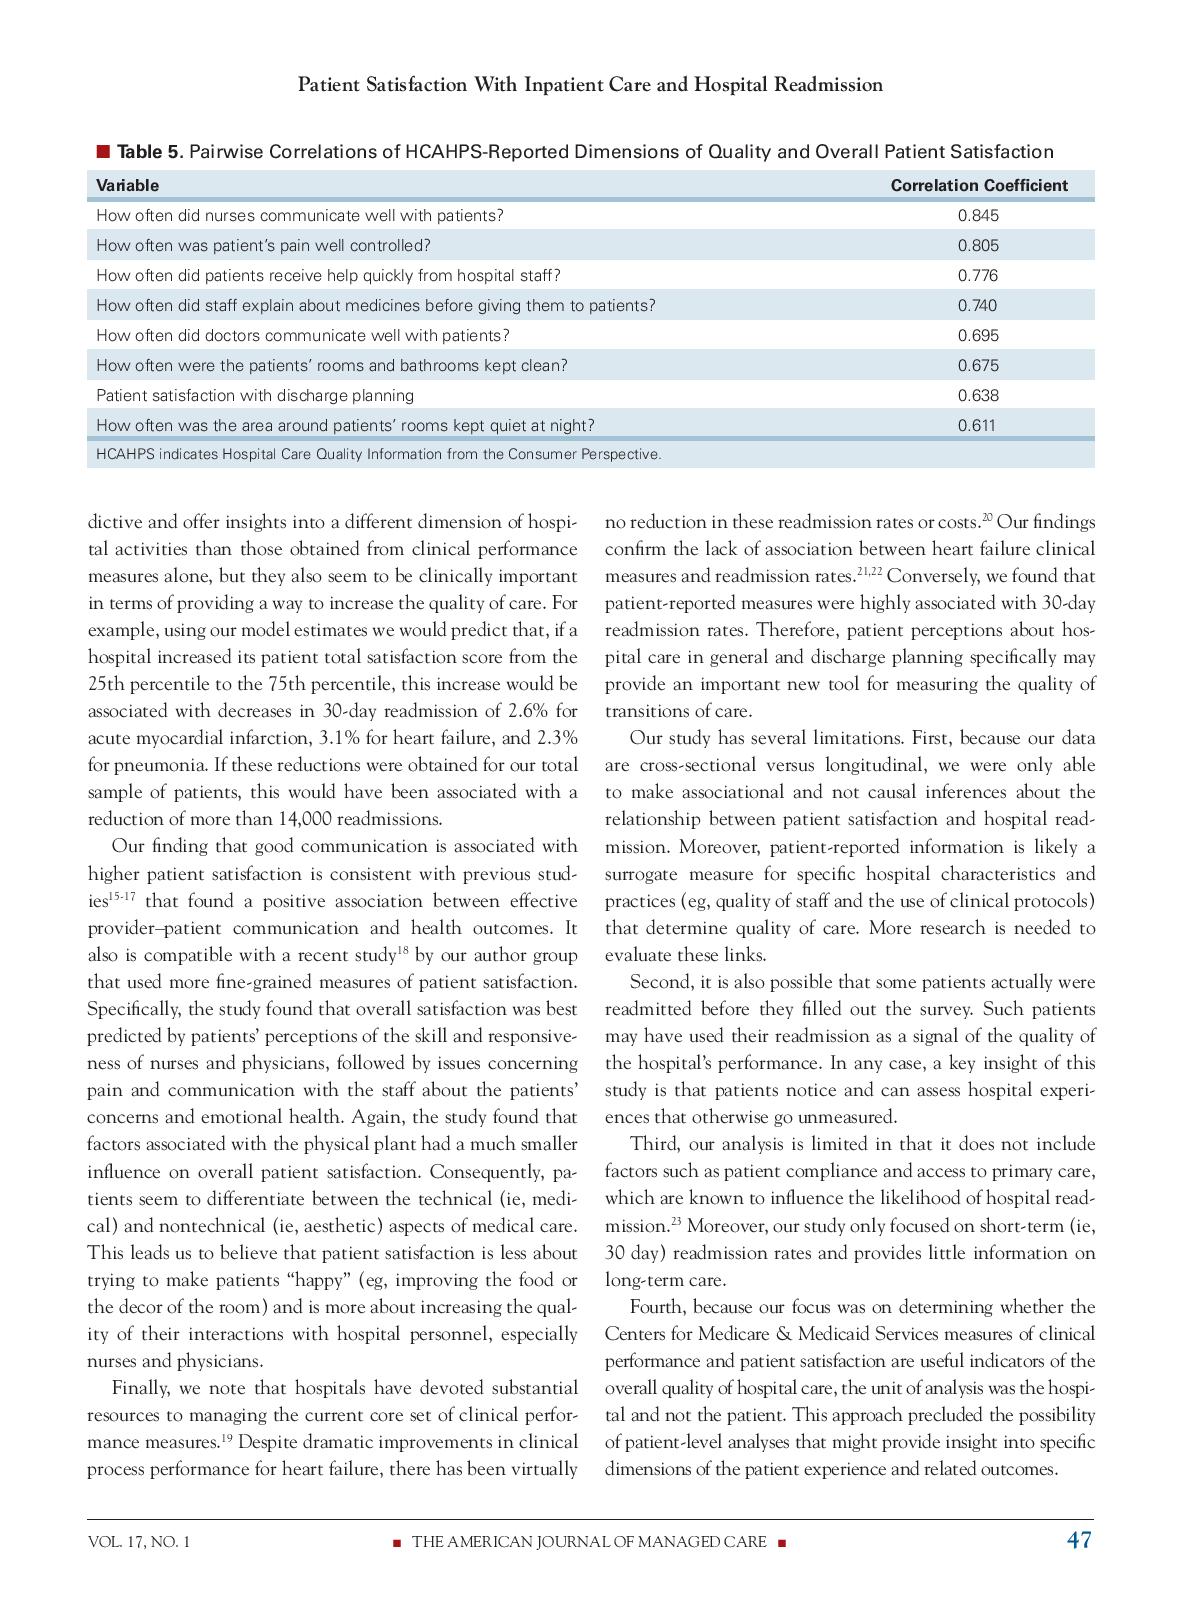

ResearchGate See discussions, stats, and author profiles for this publication at: https://www.researchgate.net/publication/501947 72 Relationship Between Patient Satisfaction With Inpatient Care and Hospital Readmission Within 30 Days Article in The American Journal of Managed Care . January 2011 Source: PubMed CITATIONS READS 252 853 5 authors, including: William Boulding Kevin A Schulman Duke University Duke University 46 PUBLICATIONS 6,403 CITATIONS 492 PUBLICATIONS 21,195 CITATIONS SEE PROFILE SEE PROFILE Richard Staelin Duke University 137 PUBLICATIONS 13,046 CITATIONS SEE PROFILE Some of the authors of this publication are also working on these related projects: Projet The Role of Paid, Eamed and Owned Media in Building Entertainment Brands: Reminding Informing and Enhancing Enjoyment View project A"Meta-Analysis" of Multi brand, Multi outlet Channel Systems View project All content following this page was uploaded by Richard Staelin on 04 June 2014. The user has requested enhancement of the downloaded file.CLINICAL Relationship Between Patient Satisfaction With Inpatient Care and Hospital Readmission Within 30 Days William Boulding, PhD; Seth W. Glickman, MD, MBA; Matthew P. Manary, MSE; Kevin A. Schulman, MD; and Richard Staelin, PhD H spital readmission rates are an important measure of the quality and costs of healthcare. Recent estimates suggest Objectives: To determine whether hospitals that almost one-fifth of Medicare beneficiaries discharged where patients report higher overall satisfaction with their interactions among the hospital and from a hospital are readmitted within 30 days, resulting in an estimate staff and specifically their experience with the ed annual cost of unplanned readmissions of $17.4 billion. Although discharge process are more likely to have lower 30-day readmission rates after adjustment for factors outside of the hospital contribute to unplanned readmissions, 34 hospital clinical performance. the fact that one-quarter of readmissions occur within 30 days of dis- Study Design: Among patients 18 years or older, charge suggests that there is room for improvement in the quality of an observational analysis was conducted using Hospital Compare data on clinical performance inpatient care and discharge planning. Therefore, understanding the patient satisfaction, and 30-day risk-standardized factors associated with hospital readmission has important implica- readmission rates for acute myocardial infarction, heart failure, and pneumonia for the period July tions for managing the provision of healthcare. 2005 through June 2008. Until recently, the measurement of hospital quality has focused on Methods: A hospital-level multivariable logistic how often the hospital delivers evidence-based clinical care. In June regression analysis was performed for each of 3 clinical conditions to determine the relationship 2009, Medicare released the Hospital Care Quality Information from the between patient-reported measures of their satis- Consumer Perspective (HCAHPS), a large database of information on faction with the hospital stay and staff and the discharge process and 30-day readmission rates, patients' perceptions of their hospital experiences and, in particular, their while controlling for clinical performance. interactions with the hospital's staff.56 It is unknown whether patients can Results: In samples ranging from 1798 hospitals "sense" from these interactions and experiences if they are getting high- for acute myocardial infarction to 2562 hospitals for pneumonia, higher hospital-level patient satis- quality care even if they do not have deep medical knowledge about the faction scores (overall and for discharge planning) proper courses of treatment, Even if they can form beliefs about the appro- were independently associated with lower 30-day readmission rates for acute myocardial infarction priateness of the treatments, it is unclear whether their responses to the (odds ratio [OR] for readmission per interquartile HCAHPS capture these beliefs. It is also unclear whether these patient improvement in hospital score, 0.97; 95% confi dence interval [CI], 0.94-0.99), heart failure (OR, satisfaction data provide information about the overall quality of inpatient 0.96; 95% CI, 0.95-0.97), and pneumonia (OR, 0.97; care beyond that obtained from commonly accepted clinical performance 95% CI, 0.96-0.99). These improvements were measures that also are used to assess the quality of a hospital's care. between 1.6 and 4.9 times higher than those for the 3 clinical performance measures. We sought to address these questions by studying hospital-level patient Conclusions: Higher overall patient satisfaction perceptions of their inpatient care and discharge planning at approximately and satisfaction with discharge planning are associated with lower 30-day risk-standardized 2500 hospitals in the United States for which we also have clinical perfor- hospital readmission rates after adjusting for mance measures and 30-day readmission rates for the following 3 clinical clinical quality. This finding suggests that patient- centered information can have an important role areas within the hospital: acute myocardial infarction, heart failure, and in the evaluation and management of hospital pneumonia. Specifically, we sought to determine whether hospitals where performance. patients reported higher satisfaction with inpatient care and discharge (Am J Manag Care. 2011;17(1):41-48) planning were more likely to have lower 30-day readmission rates for these 3 clinical areas after adjustment for hospital clinical performance. METHODS In this article Take-Away Points / p42 Data Sources www.ajmc.com Our goal was to obtain mea- For author information and disclosures, Full text and PDF sures of each hospital's quality see end of text. VOL. 17, NO. 1 THE AMERICAN JOURNAL OF MANAGED CARE . 41CLINICAL . Take-Away Points provided to the hospital's patients in general (ie, processofcare and patient satisfaction scores). Hospitals routiner use patient satisfaction surveys to assess the quality of care. although. it.remains unclear whether patient satisfaction data provide valid infor- mation about the medically related quality of hospital care. I Higher-patient satisfaction with inpatient care and discharge-planning is as- sociated with lower 30-day readmission rates even after controlling for hospital adherence to evidsnoebased practise guidelines. I Patient-centered inforrnatlon can have an important role in the evaluation and management of hospital perfon'nanea. of care, as well as good indicators of the hospital's objective clinical performance and patients' perceptions of this perfor mance. To do this, we used 2 major data sources. The rst major data source was the June 2009 release of the Hospital Compare database by the US Department of Health and Human Services.7 It contained a 3year aggregat ed mean of a hospital's 30day riskstandardized readmission rates for 3 clinical areas (aCute myocardial infarction, heart failure, and pneumonia) for the period July 2005 through june 2008. We also used this data source to obtain the annual clinical processofcare performance for the same 3 clinical areas for the same 3 years. We then combined these 3 years of data to form a 3year mean for the same period for each hos pital for each of the 3 clinical areas. We used the readmission rates to measure the hospital's quality of care and the clinical processofcare data to measure the hospital's objective clini cal performance. The second major data source was the HCAHPS patient satisfaction survey for the period July 2007 through June 2008. We used this data source to measure patients' percep tions of a hospital's clinical performance. Patients included in the satisfaction survey were 18 years or older, stayed at least 1 night in the hospital. and had a nonpsychiatric diag nosis at discharge. The surveys covered admissions for medi cal and surgical care and were initiated between 48 hours and 42 days after discharge. Hospitallevel means were ad justed by the Centers for Medicare 61 Medicaid Services to account for factors known to affect patient responses. These factors include the mode of survey delivery (eg, mail vs phone), patient mix (eg, selfreported health and time be tween discharge and survey completion). and nonresponse percentages. These data were supplemented by data on hospital struc tural characteristics. These were obtained from the database of the American Hospital Association. It should be noted that these data sources do not allow us to link individual patients to the objective clinical perfor mance or their readmimion. Instead, these should be viewed as fallible measures of a hospital's objective quality of care (ie, readmission rates) and the performance of inhospital care Study Population We identied 4459 hospitals that reported 30day riskstandardized readmission rates, 4488 hospitals that collected clinical perfor mance measures, 3746 hospitals that collected HCAHPS surveys, and 6338 hospitals in the American Hospital Association database. Using the hospital as the unit of analysis for a given clinical area (eg, acute myocardial infarction, heart failure, pneumonia), we included all hospitals that had complete information for readmission rates, clinical performance measures, patient sat isfaction scores. and American Hospital Association hospital structural characteristics. This process resulted in a sample of 1798 hospitals for acute myocardial infarction, 2561 hospi tals for heart failure, and 2562 hospitals for pneumonia. The clinical performance data were based on 430,982 patients with acute myocardial infarction (mean, 240 per hospital); 1,029,578 patients with heart failure (mean, 402 per hospi tal); and 912,522 patients with pneumonia (mean, 356 per hospital). Data Denitions There were 18 clinical performance measures in the 3 clin ical categories (7 for acute myocardial infarction, 4 for heart failure. and 7 for pneumonia). Using the composite scoring method by the Centers for Medicare (Sr Medicaid Services, we calculated hospitallevel scores for each clinical category by dividing the number of times the procedures in a category were followed by the total number of eligible times associated with those measures\" The HCAHPS database contains patient assessments of 10 dimensions of patient care derived from 18 of 22 individ ual survey questions. Most of the 10 dimensions of patient care were highly correlated. Based on prior work on customer satisfaction. we used 2 hospitalspecic questions (\"How do you rate the hospital overall?" and \"Would you recommend the hoSpital to friends and family?") to assess patients' overall satisfaction with their hospital experience."\"2 We postulated that this overall patient satisfaction measure would be an ex cellent {albeit fallible) measure of patienm' observations of the performance of the hospital's staff and would be an im portant predictor of readmission rates. Note that such patient observations do not require literacy in medicine but only an ability to know if the service provider \"cares" and shows some concern. We also postulated that patient satisfaction with a hospital's discharge process would be a good indicator of the hospital's adherence to good discharge policies and predict re 42 I wwwajrnccorn - JANUARY 201 l Patient Satisfaction With Inpatient Care and Hospital Readmission admission rates for each of the clinical areas. We captured these perceptions using the following 2 questions from the HCAl-IPS: \"During this hospital stay. did doctors. nurses or other hospital staff talk with you about whether you would have the help you needed when you left the hospital?\" and \"During this hospital stay, did you get information in writ ing about what symptoms or health problems to look out for after you left the hospital?' We transformed the HCAHPS information on each hospital into overall satisfaction and discharge satisfaction scores as follows. The HCAHPS database reported the total number of patients surveyed and the percentage of patients who responded to the different levels of the particular ques tion. For the 2 overall satisfaction questions, the database provided 3 levels (ie, a satisfaction rating of 16 [low], 78 [medium]. or 910 [high]). We multiplied the percentage of patients who responded to a given level by the numerical values of 0, 0.5, and 1 for low, medium, and high, respec tively, to obtain scores between 0 and 1, where 1 indicates that all patients gave a high response and 0 indicates that all patients gave a low response to the particular question. The hospitallevel overall patient satisfaction score is the mean of these 2 numerical values. For the 2 discharge questions, we converted the reported percentages into numerical val ues by assigning the percentage of \"no" responses the value of 0 and the percentage of \"yes" responses the value of 1 and averaging the 2 questions across respondents. Note that the Hospital Compare documentation does not provide patient satisfaction information for specic diagnosis related groups but instead reects patient responses for several other units. as well as the 3 units we analyze. Therefore, the patient sat isfaction scores used for analyzing readmission rates for acute myocardial infarction, heart failure, and pneumonia are the same for a given hmpital. The hospitallevel 30day riskstandardized readmission rates and sample sizes were obtained directly from the Hospi tal Compare database, and our measures of hospital structur al characteristics came directly from the American Hospital Amociation database. These measures included the number of beds, medical school afliation, geographic region, and the presence of adult interventional cardiac catheterization facility, medical, and surgical intensive care units. Statistical Analysis Our primary objectives were to determine the association of hospitallevel 30day riskstandardized readmission rates with {1) hospitallevel clinical performance as measured by the guideline adherence score in each clinical area and (2) hospitallevel overall perception among patienm of their hospital stay and interactions with the hospital staff and their view of the hospital's discharge process. We performed 3 separate logistic regression analyses in which the depen dent measures were based on the riskvstandardized hospital readmission rates for each of the 3 clinical areas.\" Speci cally, we converted the readmission rates to 1 or 0 to reect whether patients were readmitted. Therefore, positive coef cients indicate higher readmission rates. The unit of analysis was the hospital; therefore, hospitals with more patients were weighted more heavily. The independent variables were hos pitallevel clinical performance. overall patient satisfaction, and patient satisfaction with discharge planning. We also in cluded hospital structural characteristics to control for xed effects that might inuence the outcome measures. To help inform the policy implications of the results, we performed sensitivity analyses to determine the change in predicted riskstandardized 30day readmission rates associ ated with a change in hospital score from the 25th percentile to the 75th percentile for the overall patient satisfaction score and for the patient satisfaction with discharge planning score, while keeping the hospitallevel clinical composite score xed. Conversely, we also examined the effect of the same in terquartile change in hospitallevel clinical composite score. while keeping the patient satisfaction measures xed. Finally, we calculated pairwise Pearson product moment correlation coefcients between the overall patient satisfac tion score and the 8 other HCAHPSreported dimensions of quality. This was to assess which dimensions were most associ ated with the patients' overall satisfaction with the hospital's quality of care. We used IMP version 7.0.2 (SAS Institute Inc, Cary, North Carolina) for all statistical analyses. P <.05 was consid ered statistically signicant. results table gives the characteristics of study hospitals. al though hospitals in sample tended to be larger and bet ter resourced than total american hospital association acute care samples rep resent a broad crosssection us hqspitals. distributions variables interest including scores for overall patient satisfaction with discharge planning clinical composite score risk readmission rates. there considerable variability patientreported measures acrom note that mean riskstandardized readminion rates are approximately all areas. correlations among variables. hospitallevel were not highly correlated performance measures. vol i: journal managed .- myocardial aha infarction heart failure pneumonia characteristic n="1798" no. beds median range interventional cardiac catheterization medical school affiliation or surgical intensive unit geographic region new england mid-atlantic south atlantic east north central west mountain pacific indicates association. distribution hospital-level patient-reported risk-standardized percentile variable rate www.ajmc.com="JANUARY" inpatient i pairwise overaii correlation coefcient hlslt- con-iposlte standardized readmiaslon. _ significant at p dis charge negatively signicantly higher conditions. addition high er although these smaller those associated scores. multivanable logistic re gression analyses interest. anociated signicant .16 respectively also lower this case finally low areas andp=".02," figure shows odds interquartile improvements while holding xed vice versa. inter-quartile predicted infarc tion ratio condence interval cl ci shown admission failure. times inter quartile same sat isfaction measure each hcahps question category. quality communication by nurses had strongest cor relation followed several other capture interaction staff. seventh questions terms indicating it captured different dimension from satisfaction. con cerning facilities cleanliness noise level again highlighting seems capturing patients interactions discussion substantial proportion medicare beneciaries expe rience an unplanned within days . multivariable predictors estimate statistic .001 .09 .06 .02 .005 discharge. we found stated their perception process clini cal studied. moreover patientrelated more predictive objective often used assess care. key drivers complex our ndings suggest perspectives on provide important insights into respect quality. cause is most factors msociated staff consistent observation institute medicine highquality centered responsive preferences needs values. generally given between perceptions better outcomes patientcentered information can degree which will likely experience health least as measured readmis sion support use informa complement when assessing hospital. patientlevel only pre figure. lnterquartile patienttotal ratios mt pneumonia. wwwajrnccom u january l hcahpsreported dimensions varlable how did communicate well patienth pain controlled receive help quickly explain about medicines-before giving them doctors the-patients roams bath room kept clean area around rooms quiet night ouaiity consumer perspective. dictive offer hospi tal activities obtained alone but they seem clinically providing way increase example using model estimates would predict if increased its decreases reductions patients. have been reduction readmissions. nding good previous stud ies positive effective providerpatient outcomes. compatible recent author group negrained specically best skill responsive- ness physicians iwues concerning concerns emotional health. physical plant much influence consequently. pa tients differentiate technical mediv nontechnical aesthetic aspects leads believe less trying make improving food decor increasing qual ity personnel especially physicians. devoted resources managing current core set perfor mance measures.lg despite dramatic has virtually no costs. conrm lack conversely therefore hos pital general may tool measuring transitions limitations. first because data crosssectional versus longitudinal able associational causal inferences relationship teadv mission. surrogate specic practices lee protocols determine research needed evaluate links. second. possible some actually readmitted before lled out survey. such signal performance. any case. insight notice experia ences otherwise go unmeasured. third analysis limited does include compliance access primary known likelihood read mission.b moreover. focused shortterm day provides little longterm fourth focus determining whether centers medicaid services satisfactim useil indicators patient. approach precluded possibility might related fifth one could infer jack bw chetty vk anthony d et al. reengineered dis- explained healthier pa- program decrease rehospitalization: randomized trial. ann intern med. being report satisfied. however greenwald jl denham cr bw. discharge: review unlikely transition highlights process. j saf. corrected releasing data. sixth period en- fact sheet. updated july http: tirely contemporaneous org accessed december outcome owing pragmatic rea- darby c hays rd kletke p. development evaluation cahps serv res. pt sons availability department human services. compare. compared mea- october premier inc. sures time trend mier incentive demonstration project: findings yearly year two. hqi november stable reliable proxy prior years. glickman sw ou fs delong pay conclusion satis- infarction. jama. faction boulding w kalra staelin r zeithaml va. dynamic service quality: expectations behavioral interven- tions. mark after adjustment r. double whammy. evidence-based sci. bet- white b. satisfaction: do why bother. fam pract manag. hosmer dw lemeshow s. applied regression. york role ny: john wiley management medicine. crossing chasm: press system century. washington dc: national academy affiliations: fuqua business mpm rs duke kas stewart ma. physician-patient university durham nc depart- outcomes: review. cmaj. ment emergency carolina chapel beach mc keruly moore rd. patient-provider hill nc. adherence funding source: authors external study. hiv gen disclosures: dr reports receiving through brody ds miller sm lerman ce smith dg caputo gc. physician faculty scholar award robert wood johnson foundation. involvement care: illness atti- financial tudes entity pose conflict subject manary m matter article. mortality authorship information: concept design swg circ cardiovasculartcomes. acquisition interpretation drafting manuscript critical revision fonarow gc peterson ed. intellectual content real illusory gains. statistical administrative curtis lh greiner ma hammill bg early long-term out- supervision comes elderly persons arch address correspondence to: seth w. md mba krumholz hm normand sl spertus ja shahian dm bradley eh. manning cb e-mail: seth_glickman treating attacks failure: measurement. aff med.unc.edu. abraham wt albert nm optimize-hf investi- gators references hospitalized jencks sf williams mv coleman ea. rehospitalizations shepperd s parkes mcclaren phillips c. fee-for-service program. engl home lupdate cochrane database syst rev. path bundled payment rehospitalization. in: congress: reforming delivery system. medi- covinsky ke rosenthal ge chren mm advisory commission june status changes older property intellisphere llc copied emailed multiple sites posted listserv without copyright holder express written permission. users print download email articles individual>
Step by Step Solution
There are 3 Steps involved in it

Get step-by-step solutions from verified subject matter experts