

Question: The vapor pressure, P, of a certain liquid was measured at two temperatures, T. The data is shown in the table. T(K) P (kPa)
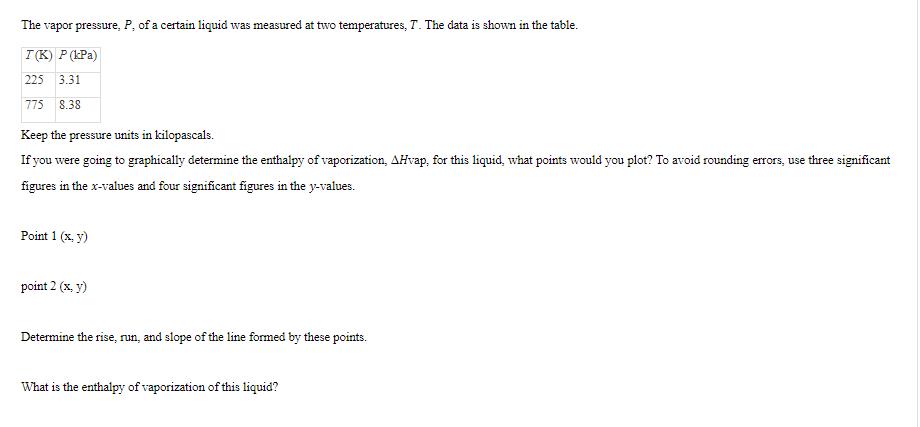
The vapor pressure, P, of a certain liquid was measured at two temperatures, T. The data is shown in the table. T(K) P (kPa) 225 3.31 775 8.38 Keep the pressure units in kilopascals. If you were going to graphically determine the enthalpy of vaporization, AHvap, for this liquid, what points would you plot? To avoid rounding errors, use three significant figures in the x-values and four significant figures in the y-values. Point 1 (x, y) point 2 (x, y) Determine the rise, run, and slope of the line formed by these points. What is the enthalpy of vaporization of this liquid?
Step by Step Solution
There are 3 Steps involved in it
Solutions It is just a form of Clausiusclapyeron eq... View full answer

Get step-by-step solutions from verified subject matter experts