

Question: Identify test statistic (round to two decimal places as needed) Find p-value (round to three decimal places as needed) Find the confidence interval for the
Identify test statistic (round to two decimal places as needed)
Find p-value (round to three decimal places as needed)
Find the confidence interval for the difference of two proportions p1-p2 corresponding to the test in part a, as needed. (round to three decimal places as needed)
Interpret the interval as needed:
A. For ___% of samples, the proportion of low birth weight babies will be between ___% and ____% higher for mothers exposed to high levels of air pollution than those who are not.
B. One can be ___% confident that the population proportion of low-birthweight babies will be between ___% and ____% higher for mothers exposed to high levels of air pollution than those who are not.
C. One can be ___% confident that the population proportion of low-birthweight babies will be between ___% and ____% lower for mothers exposed to high levels of air pollution than those who are not.
D. It was concluded that there was no difference in proportions.
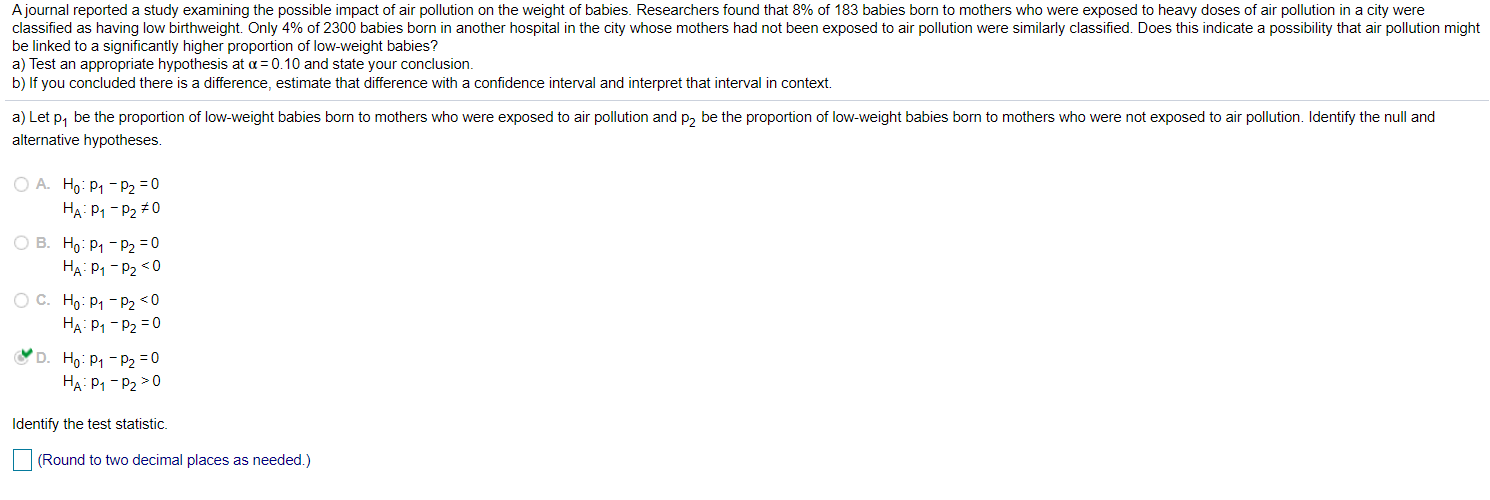
A journal reported a study examining the possible impact of air pollution on the weight of babies. Researchers found that 8% of 183 babies born to mothers who were exposed to heavy doses of air pollution in a city were classified as having low birthweight. Only 4% of 2300 babies born in another hospital in the city whose mothers had not been exposed to air pollution were similarly classified. Does this indicate a possibility that air pollution might be linked to a significantly higher proportion of low-weight babies? a) Test an appropriate hypothesis at a = 0.10 and state your conclusion. b) If you concluded there is a difference, estimate that difference with a confidence interval and interpret that interval in context. a) Let p, be the proportion of low-weight babies born to mothers who were exposed to air pollution and p2 be the proportion of low-weight babies born to mothers who were not exposed to air pollution. Identify the null and alternative hypotheses. O A. Ho: P1 - P2 = 0 HA : P1 - P2 # 0 O B. Ho: P1 - P2 = 0 HA: P1 - P2 0 O C. Ho: P1 - P2 0 HA : P1 - P2 = 0 D. Ho: P1 - P2 = 0 HA: P1 - P2 >0 Identify the test statistic. (Round to two decimal places as needed.)
Step by Step Solution
There are 3 Steps involved in it

Get step-by-step solutions from verified subject matter experts