

Question: Identify the candlestick pattern highlighted in the chart: A. Bullish engulfing B. Hammer C. Hanging man O D. Inverted hammer O E. Evening star The
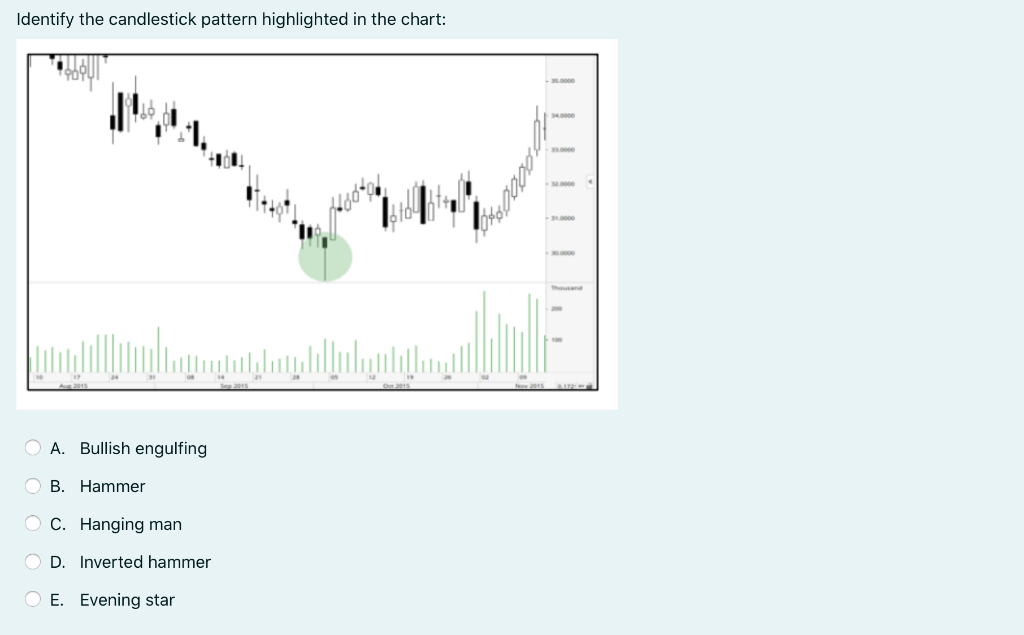
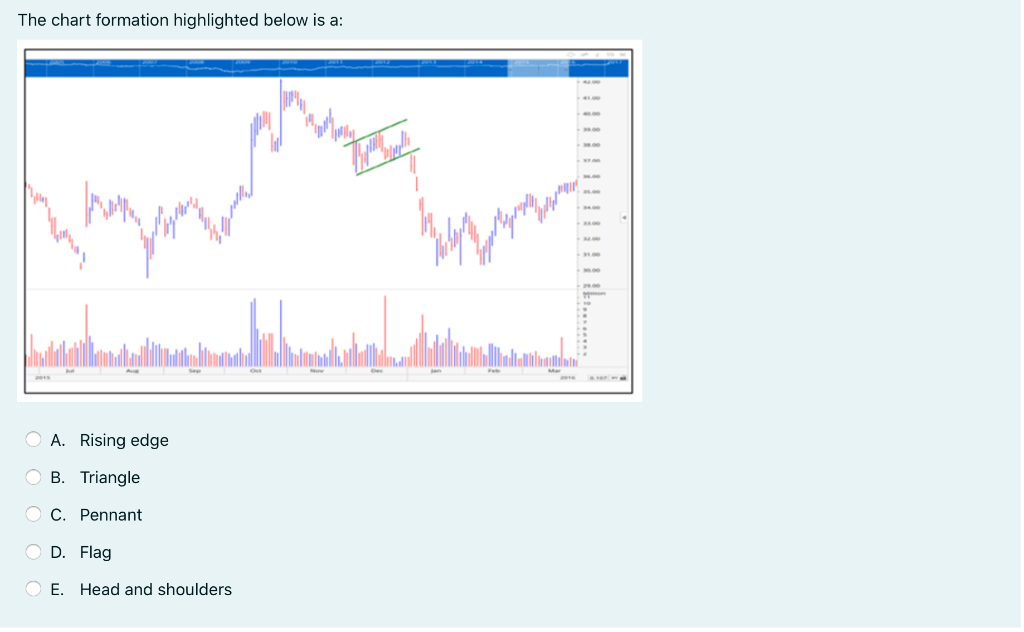
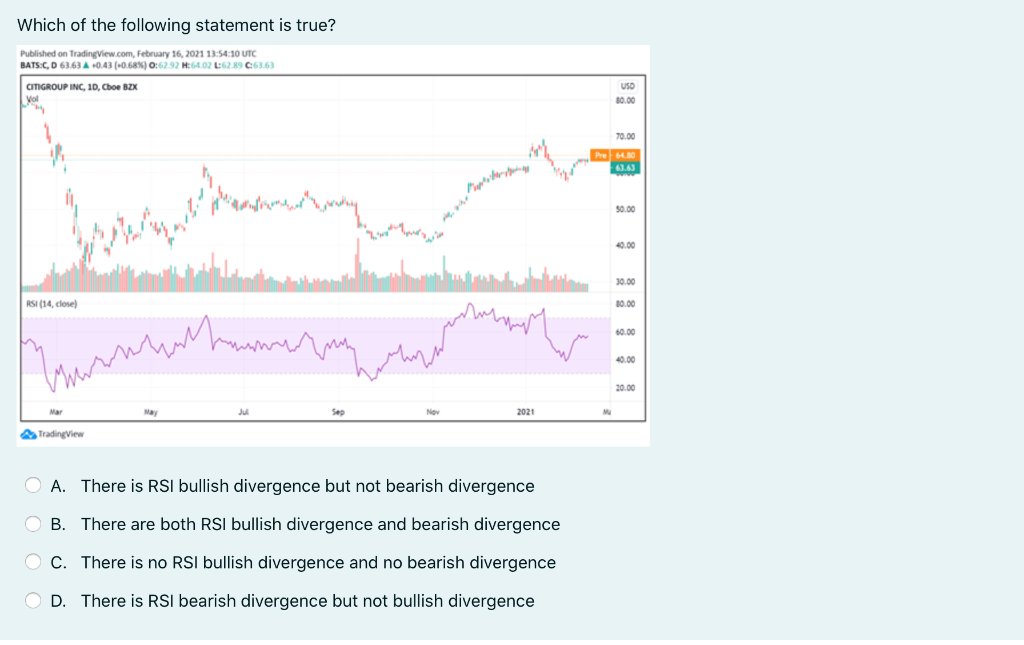
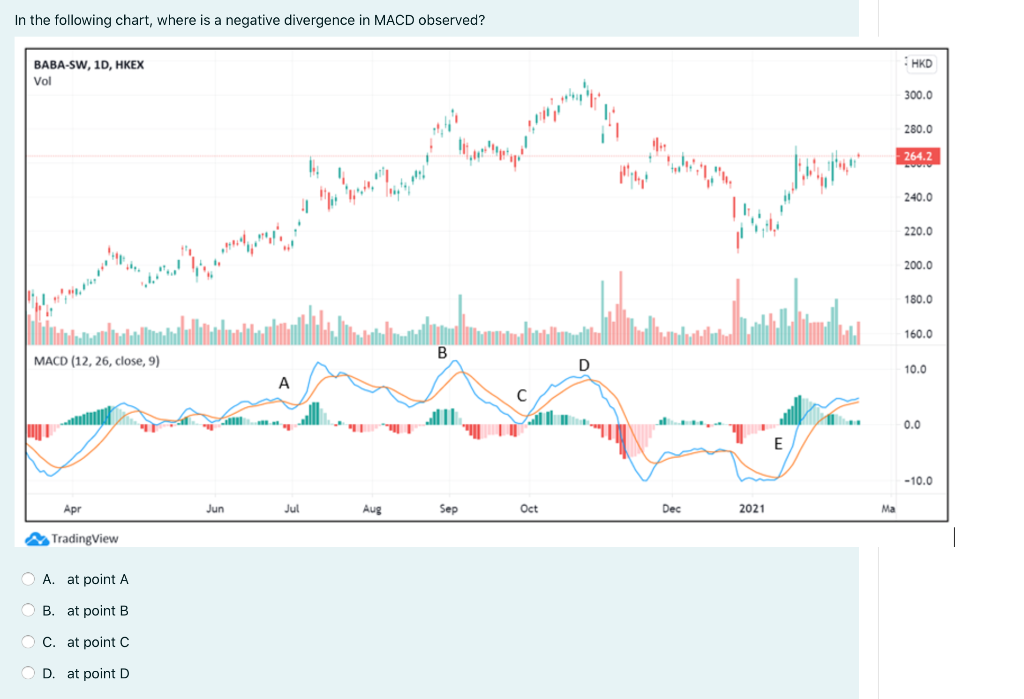
Identify the candlestick pattern highlighted in the chart: A. Bullish engulfing B. Hammer C. Hanging man O D. Inverted hammer O E. Evening star The chart formation highlighted below is a: wanakondylus un loc multilateral O A. Rising edge B. Triangle C. Pennant D. Flag E. Head and shoulders Which of the following statement is true? Published on Trading View.com, February 16, 2021 13:54:10 UTC BATS.C,D 63.63 A 0.43(-0.68%) 0:62.92 H:64.02 L:62.89 6:6363 CITIGROUP INC, 1D, Cboe BZX vol USD 30.00 70.00 Pre 1.80 esteething 50.00 40.00 30.00 RSI (14, close) 19.00 60.00 Mummam ), homem 40.00 20.00 Mar May 2021 TradingView O A. There is RSI bullish divergence but not bearish divergence B. There are both RSI bullish divergence and bearish divergence C. There is no RSI bullish divergence and no bearish divergence D. There is RSI bearish divergence but not bullish divergence In the following chart, where is a negative divergence in MACD observed? HKD BABA-SW, 1D, HKEX Vol 300.0 280.0 264.2 240.0 220.0 200.0 180.0 160.0 MACD (12, 26, close, 9) D 10.0 0.0 E -10.0 Apr Jun Jul Aug Sep Oct Dec 2021 Ma TradingView O A. at point A O B. at point B O C. at point C D. at point D
Step by Step Solution
There are 3 Steps involved in it

Get step-by-step solutions from verified subject matter experts