

Question: Identify the errors with the following graph. Select all that apply. Distance travelled by a snail measured at 5 second intervals 300 250 200 y=
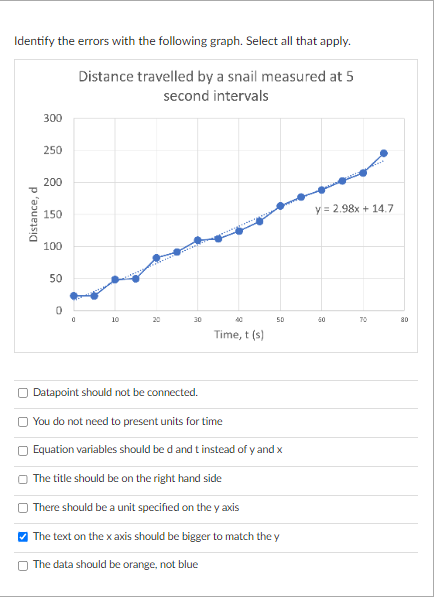
Identify the errors with the following graph. Select all that apply. Distance travelled by a snail measured at 5 second intervals 300 250 200 y= 2.98x + 14.7 Distance, d 150 100 50 20 30 50 TO Time, t [s) O Datapoint should not be connected. O You do not need to present units for time O Equation variables should be d and t instead of y and x The title should be on the right hand side O There should be a unit specified on the y axis The text on the x axis should be bigger to match the y O The data should be orange, not blue
Step by Step Solution
There are 3 Steps involved in it
1 Expert Approved Answer
Step: 1 Unlock

Question Has Been Solved by an Expert!
Get step-by-step solutions from verified subject matter experts
Step: 2 Unlock
Step: 3 Unlock