

Question: Identify the indicated values or interpret the given display. Use the normal distribution as an approximation to the binomial distribution. . Use a 0.05 significance
Identify the indicated values or interpret the given display. Use the normal distribution as an approximation to the binomial distribution. . Use a 0.05 significance level and answer the following:
a. Is the test two-tailed, left-tailed, or right-tailed?
b. What is the test statistic?
c. What is the P-value?
d. What is the null hypothesis, and what do you conclude about it?
e. What is the final conclusion?
In a TE Connectivity survey of 1000 adults, 29% said that they would feel comfortable in a self-driving vehicle. The accompanying StatCrunch display results from testing the claim that more than 1/4 of adults feel comfortable in a self-driving vehicle.
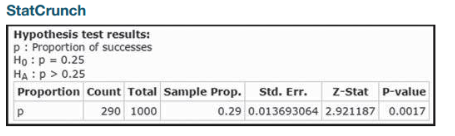
StatCrunch Hypothesis test results: p : Proportion of successes Ho : p = 0.25 HA : P > 0.25 Proportion Count Total Sample Prop. Std. Err. Z-Stat P-value P 290 1000 0.29 0.013693064 2.921187 0.0017
Step by Step Solution
There are 3 Steps involved in it

Get step-by-step solutions from verified subject matter experts