

Question: Identify the null hypothesis, alternative hypothesis, test statistic, Pvalue, conclusion about the null hypothesis, and final conclusion that addresses the original claim. 7') In a
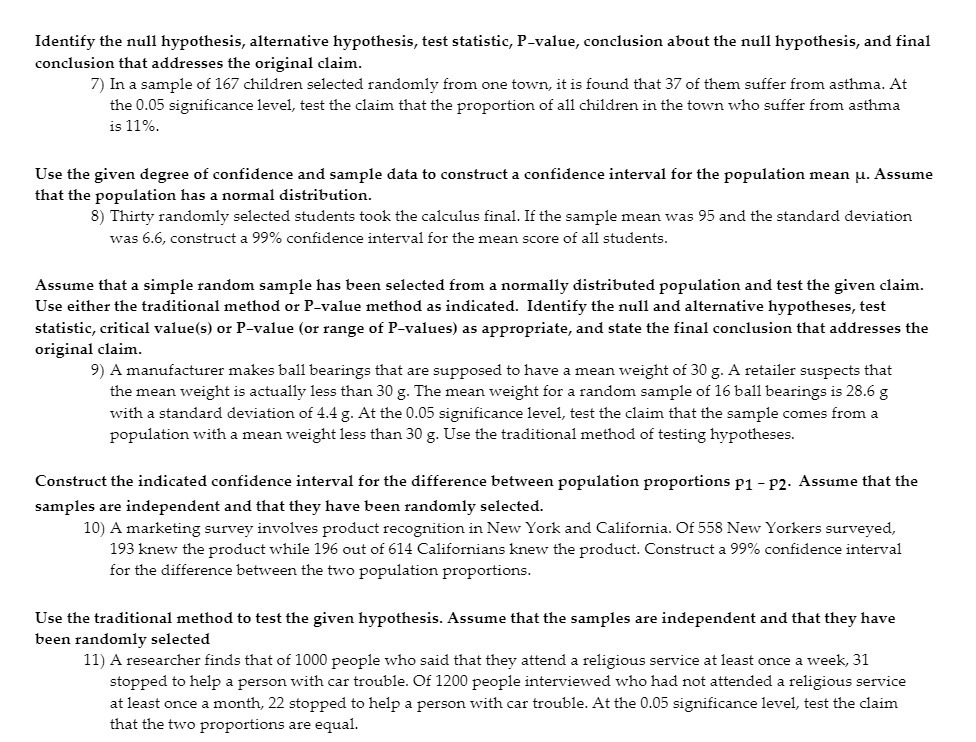
Identify the null hypothesis, alternative hypothesis, test statistic, Pvalue, conclusion about the null hypothesis, and final conclusion that addresses the original claim. 7') In a sample of 167 children selected randomly from one town, it is found that 37 of them suffer from asthma. At the 0.05 significance level, test the claim that the proportion of all children in the town who suffer from asthma is 11%. Use the ven degree of confidence and sanlple data to construct a condence interval for the population mean u. Assunle that the population has a normal distribution. 3) Thirty randomly selected students took the calculus final. Ifthe sample mean was 95 and the standard deviation was 6.6, construct a 99% confidence interval for the mean score of all students. Assume that a simple random sample has been selected from a normally distributed population and test the given claim. Use either the traditional method or Pvalue method as indicated. Identify the null and alternative hypotheses, test statistic, critical value (5) or Pvalue (or range of Pvalues] as appropriate, and state the final conclusion that addresses the original claim. 9) A manufacturer makes ball bearings that are supposed to have a mean weight of 30 g. A retailer suspects that the mean weight is actually less than 30 g. The mean weight for a random sample of 16 ball bearings is 28.6 g with a standard deviation of 4.4 g. At the 0.05 significance level, test the claim that the sample comes from a population with a mean weight less than 30 3. Use the traditional method of testing hypotheses. Construct the indicated confidence interval for the difference between population proportions p1 p2. Assume that the samples are independent and that they have been randome selected. 10] A marketing survey involves product recognition in New York and California. Of 558 New Yorkers surveyed, 193 knew the product svhile 196 out of 614 Californians knew the product. Construct a 99% condence interval for the difference between the two population proportions. Use the traditional method to test the given hypothesis. Assume that the samples are independent and that they have been randomly selected 1 1] A researcher finds that of 1000 people who said that they attend a religious service at least once a week, 31 stopped to help a person 1with car trouble. Of 1200 people interviewed who had not attended a religious service at least once a month, 22 stopped to help a person with car trouble. At the 0.05 signicance level, test the dainl that the two proportions are equal
Step by Step Solution
There are 3 Steps involved in it

Get step-by-step solutions from verified subject matter experts