

Question: Identify whether the data looks linear and whether it looks like a strong or weak correlation and if it is a positive or negative relationship.
- Identify whether the data looks linear and whether it looks like a strong or weak correlation and if it is a positive or negative relationship.
- Find the line of best fit and write down your equation.
- Find the r value. Does this support your answer for #3? Why or why not?
- Use your line of best fit to make a prediction for a value outside your data. Explain in words.
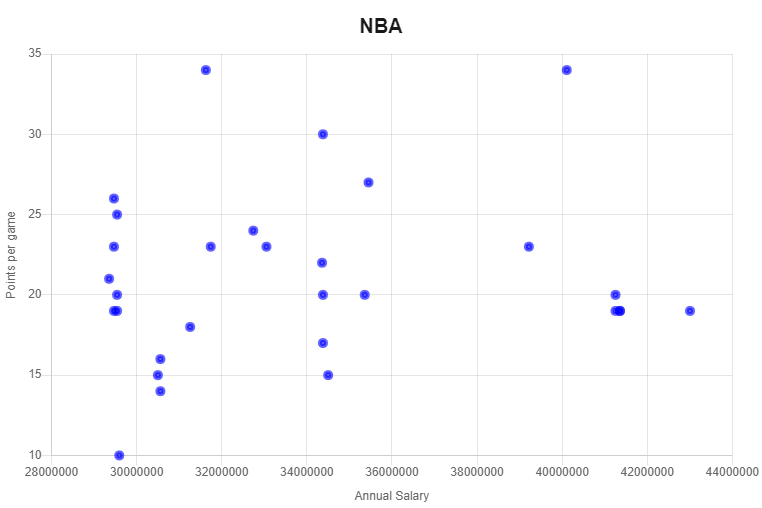
35 25 Pointo por game 20 15 28000000 30000000 320 0DOLO 3400DO0D 36000000 3-8000000 40006000 42000000 44000000 Annual Salary
Step by Step Solution
There are 3 Steps involved in it
1 Expert Approved Answer
Step: 1 Unlock

Question Has Been Solved by an Expert!
Get step-by-step solutions from verified subject matter experts
Step: 2 Unlock
Step: 3 Unlock