

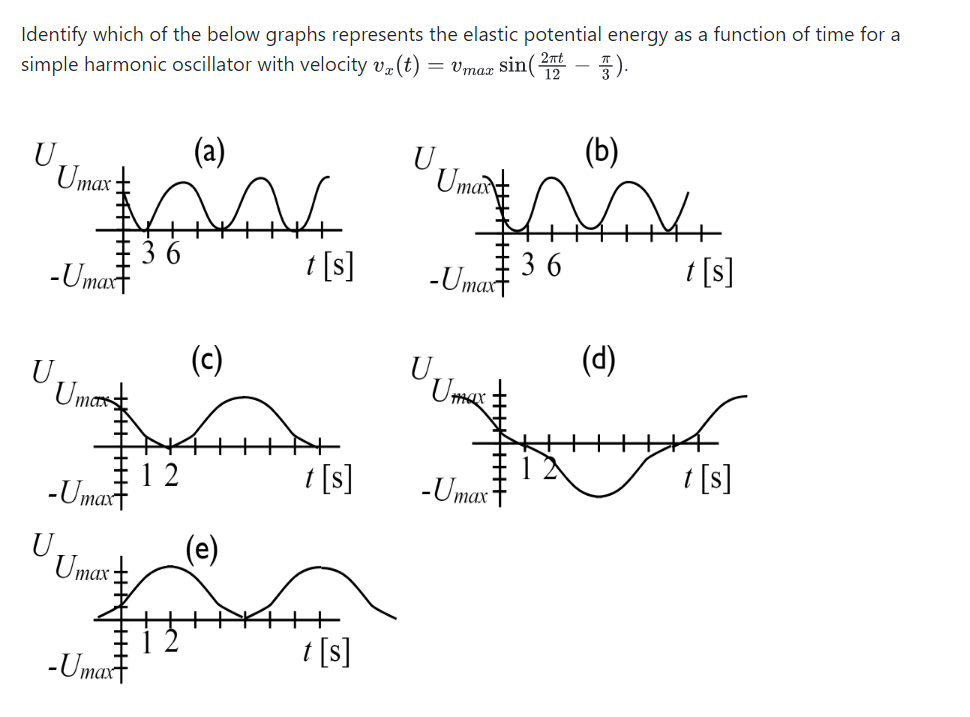
Question: Identify which of the below graphs represents the elastic potential energy as a function of time for a simple harmonic oscillator with velocity v x
Identify which of the below graphs represents the elastic potential energy as a function of time for a
simple harmonic oscillator with velocity
Step by Step Solution
There are 3 Steps involved in it
1 Expert Approved Answer
Step: 1 Unlock

Question Has Been Solved by an Expert!
Get step-by-step solutions from verified subject matter experts
Step: 2 Unlock
Step: 3 Unlock