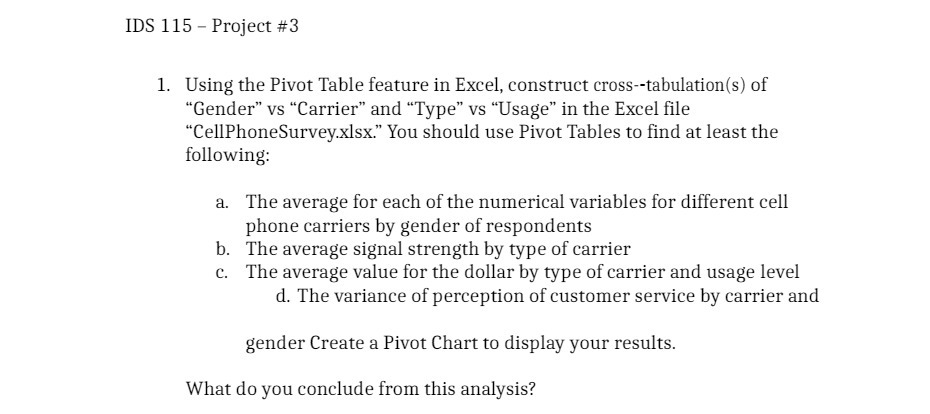
Question: IDS 115 - Project #3 1. Using the Pivot Table feature in Excel, construct cross--tabulation(s) of Gender vs Carrier and Type vs Usage in the

IDS 115 - Project #3 1. Using the Pivot Table
IDS 115 - Project #3 1. Using the Pivot Table feature in Excel, construct cross--tabulation(s) of \"Gender" vs \"Carrier" and \"Type\" vs \"Usage\" in the Excel le \"CellPhoneSurveyxlsx.\" You should use Pivot Tables to nd at least the following: a. The average for each of the numerical variables for different cell phone carriers by gender of respondents h. The average signal strength by type of carrier c. The average value for the dollar by type of carrier and usage level d. The variance of perception of customer service by carrier and gender Create a Pivot Chart to display your results. What do you conclude from this analysis

Step by Step Solution

There are 3 Steps involved in it

1 Expert Approved Answer
Step: 1 Unlock blur-text-image
Question Has Been Solved by an Expert!

Get step-by-step solutions from verified subject matter experts

Step: 2 Unlock
Step: 3 Unlock

Students Have Also Explored These Related Accounting Questions!