

Question: If 1000 is invested at 7 5 compounded continuously graph the amount in the account as a function of time for a period of 9

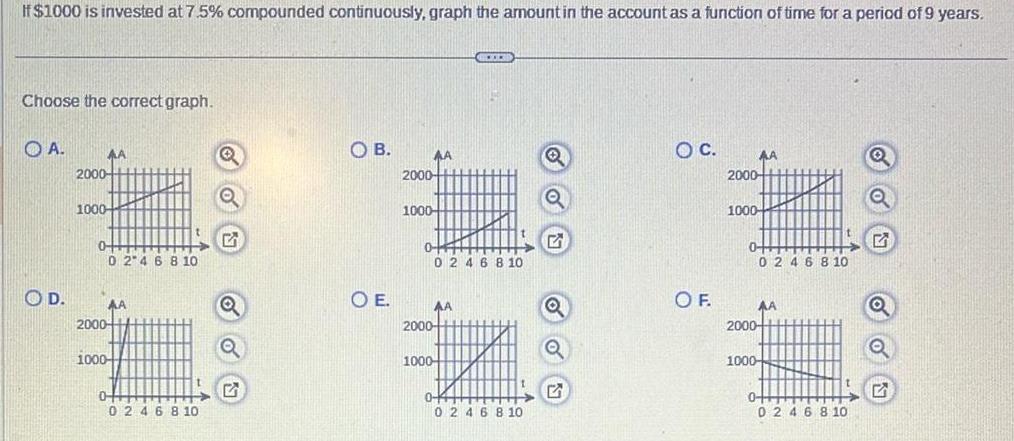
If 1000 is invested at 7 5 compounded continuously graph the amount in the account as a function of time for a period of 9 years Choose the correct graph A OD AA 2000 1000 0 4 0 2 4 6 8 10 AA 2000 1000 0 02 4 6 8 10 Q Q Q Q 5 OB OE AA 2000 1000 0 02 4 6 8 10 AA 2000 CEED 1000 0 14 02468 10 Q Q Q Q O C OF AA 2000 1000 0 0 2 4 6 8 10 AA 2000 1000 0 0 2 4 6 8 10 Q
Step by Step Solution
There are 3 Steps involved in it
1 Expert Approved Answer
Step: 1 Unlock

Question Has Been Solved by an Expert!
Get step-by-step solutions from verified subject matter experts
Step: 2 Unlock
Step: 3 Unlock