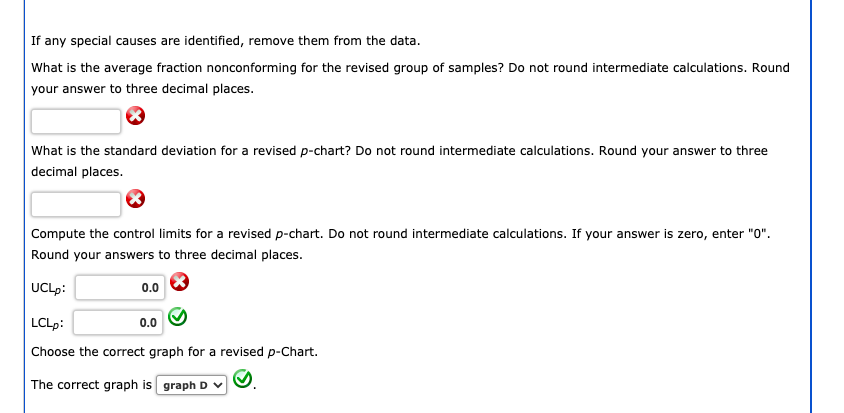
Question: If any special causes are identified, remove them from the data. What is the average fraction nonconforming for the revised group of samples? Do not

If any special causes are identified, remove them from the data.

What is the average fraction nonconforming for the revised group of samples? Do not round intermediate calculations. Round your answer to three decimal places.

What is the standard deviation for a revised p-chart? Do not round intermediate calculations. Round your answer to three decimal places.

Compute the control limits for a revised p-chart. Do not round intermediate calculations. If your answer is zero, enter "0". Round your answers to three decimal places.If any special causes are identified, remove themIf any special causes are identified, remove them

D. Attribute (p) Chart 0.18 600.16 0.14 0.12 Fraction - nonconforming 0.1 0.08 0.06 0.04 0.02 new -2 -1 1 2 3 4 5 6 7 8 9 10 11 12 13 14 15 16 17 18 19 20 21 22 23 24 25 -0.021 Sample number Fraction nonconforming 1 Lower controllimit Upper controllimit Center line TIT If any special causes are identified, remove them from the data. What is the average fraction nonconforming for the revised group of samples? Do not round intermediate calculations. Round your answer to three decimal places. What is the standard deviation for a revised p-chart? Do not round intermediate calculations. Round your answer to three decimal places. Compute the control limits for a revised p-chart. Do not round intermediate calculations. If your answer is zero, enter "0". Round your answers to three decimal places. UCLP: 0.0 % LCL: 0.0 Choose the correct graph for a revised p-Chart. The correct graph is graph D D. Attribute (p) Chart 0.18 600.16 0.14 0.12 Fraction - nonconforming 0.1 0.08 0.06 0.04 0.02 new -2 -1 1 2 3 4 5 6 7 8 9 10 11 12 13 14 15 16 17 18 19 20 21 22 23 24 25 -0.021 Sample number Fraction nonconforming 1 Lower controllimit Upper controllimit Center line TIT If any special causes are identified, remove them from the data. What is the average fraction nonconforming for the revised group of samples? Do not round intermediate calculations. Round your answer to three decimal places. What is the standard deviation for a revised p-chart? Do not round intermediate calculations. Round your answer to three decimal places. Compute the control limits for a revised p-chart. Do not round intermediate calculations. If your answer is zero, enter "0". Round your answers to three decimal places. UCLP: 0.0 % LCL: 0.0 Choose the correct graph for a revised p-Chart. The correct graph is graph D

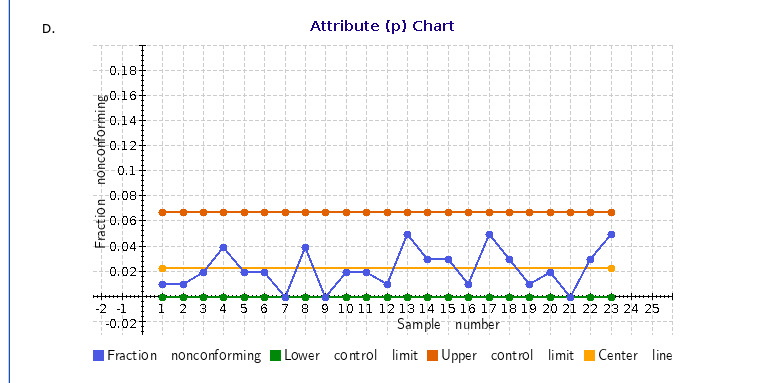
Step by Step Solution

There are 3 Steps involved in it

1 Expert Approved Answer
Step: 1 Unlock blur-text-image
Question Has Been Solved by an Expert!

Get step-by-step solutions from verified subject matter experts

Step: 2 Unlock
Step: 3 Unlock

Students Have Also Explored These Related General Management Questions!