

Question: if anything is missing please add it yourself thanks PepsiCo, Inc. Balance Sheet December 25, 2010 and December 26, 2009 2010 2009 Assets Currents assets
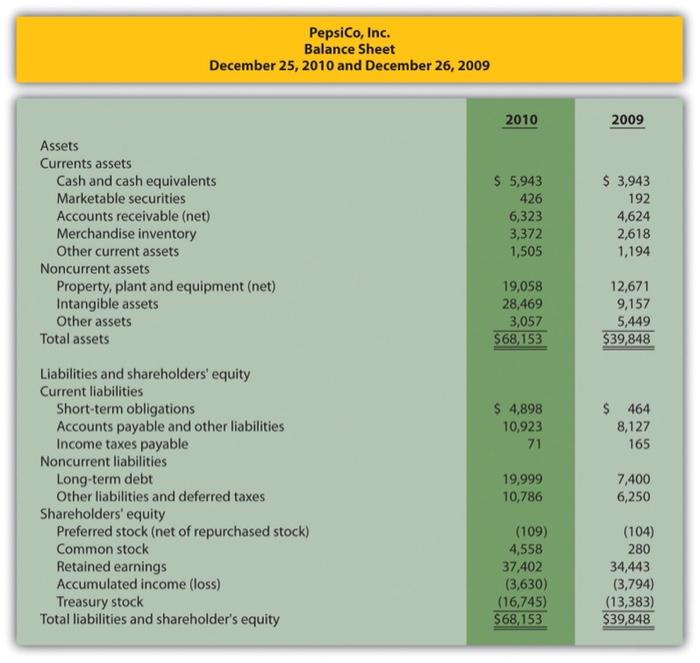

PepsiCo, Inc. Balance Sheet December 25, 2010 and December 26, 2009 2010 2009 Assets Currents assets Cash and cash equivalents Marketable securities Accounts receivable (net) Merchandise inventory Other current assets Noncurrent assets Property, plant and equipment (net) Intangible assets Other assets Total assets $ 5,943 426 6,323 3,372 1,505 $ 3,943 192 4,624 2,618 1,194 19,058 28,469 3,057 $68,153 12,671 9,157 5,449 $39,848 $ 4,898 10,923 71 $ 464 8,127 165 Liabilities and shareholders' equity Current liabilities Short-term obligations Accounts payable and other liabilities Income taxes payable Noncurrent liabilities Long-term debt Other liabilities and deferred taxes Shareholders' equity Preferred stock (net of repurchased stock) Common stock Retained earnings Accumulated income (loss) Treasury stock Total liabilities and shareholder's equity 19,999 10,786 7,400 6,250 (109) 4,558 37,402 (3,630) (16,745) $68,153 (104) 280 34,443 (3,794) (13,383) $39,848 1. Prepare and interpret financial statements in Horizontal & Vertical form 2. Compute and interpret financial ratios used to measure common shareholders' well-being. 3. Compute and interpret financial ratios used to measure short-term creditors' well-being 4. Compute and interpret financial ratios used to measure long-term creditors' well-being
Step by Step Solution
There are 3 Steps involved in it

Get step-by-step solutions from verified subject matter experts