

Question: If i am given the historical return for. U.S. 3 Mo.T-Bill. Global Bonds. U.S. Equities. Non-U.S. Equities. and Hedge Funds from jan 2008 till October
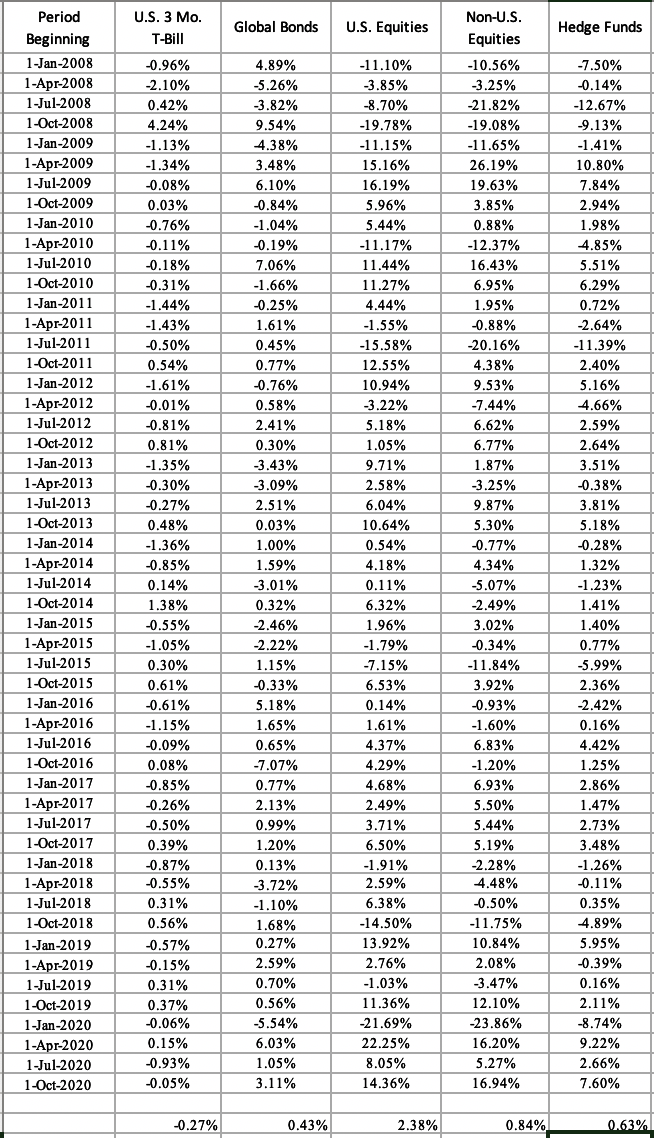
If i am given the historical return for. U.S. 3 Mo.T-Bill. Global Bonds. U.S. Equities. Non-U.S. Equities. and Hedge Funds from jan 2008 till October 2020 quarterly , how can i get their projected return and risk? and correlation
Given the following tips
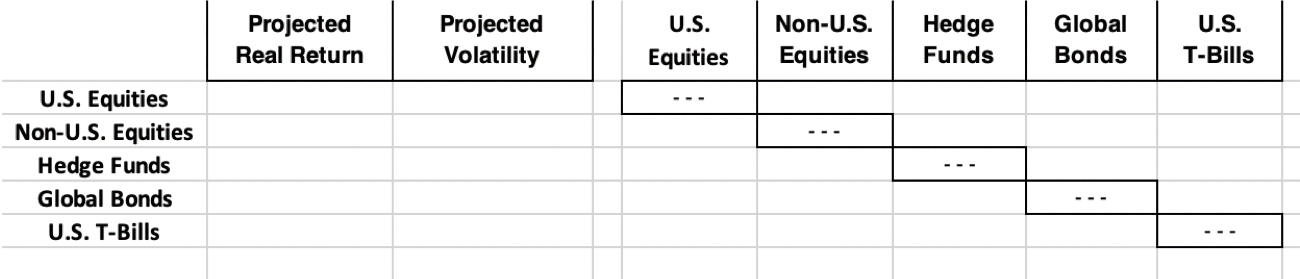
To determine this "optimal" combination, you should use all or at least a 10-year portion of the quarterly return data from the period 1/1/2008 through 12/31/2020 contained within the spreadsheet entitled "Real Returns" to calculate risk, return, and correlation relationships, which you should then employ as your forward looking estimates [note: please remember that volatility expands proportionally with the square root of time when you convert quarterly standard deviations (i.e., volatilities) to their annual equivalents]. To be clear, you may use the entire data set or a subset of this data so long as that subset encompasses a ten-year span. As a first step, please fill in the "Projected Real Return" and "Projected Volatility" columns as well as pair-wise correlations within the section immediately to the right of those columns within the Project One Data file. Then use these forecasts to determine your optimal asset allocation solution. Target Volatilities: Teams are assigned the following target annualized volatilities for which they should attempt to determine the highest possible expected return: 18%
Step by Step Solution
There are 3 Steps involved in it

Get step-by-step solutions from verified subject matter experts