

Question: If I could get some help with the question below I'd really appreciate it. I don't understand how to use the R software which makes
If I could get some help with the question below I'd really appreciate it. I don't understand how to use the R software which makes these questions difficult for me.
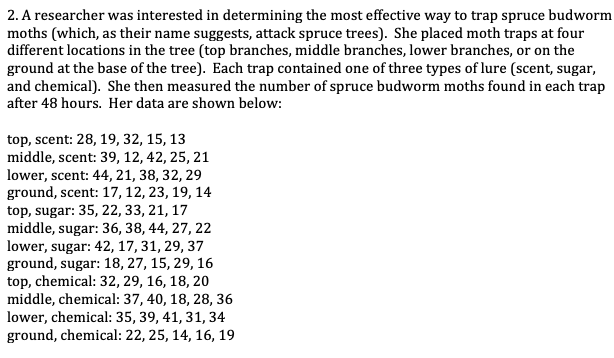
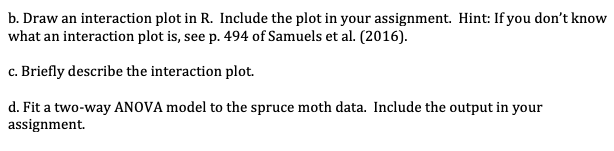
2. .4 researcher was interested in determining the most effective way to trap spruce hudworin moths (which, as their name suggests, attack spruce trees]. She placed moth traps at four different locations in the tree [top hranches, middle branches, lower branches, or on the ground at the base of the tree]. Each trap contained one of three types of lure (scent, sugar, and chemical]. She then measured the number of spruce hudworm moths found in each trap after 43 hours. Her data are shown below: top, scent: 23, 13, 32, 15, 13 middle, scent: 33, 12, 42, 25, 2 1 lower, scent: 44, 21, 33, 32, 23 ground, scent: 1?, 12, 23, 13, 14 top, sugar: 35, 22, 33, 2 1, 1? middle, sugar: 35, 33, 44, 2?, 22 lower, sugar: 42, 1?, 31, 23, 3? ground, sugar: 13, 2?, 15, 23, 13 top, chemical: 32, 23, 13, 13, 2|]I middle, chemical: 3?, 43, 13, 23, 33 lower, chemical: 35, 33, 41, 31, 34 ground, chemical: 22, 25, 14, 13, 13 b. Draw an interaction plot in R. Include the plot in your assignment. Hint: If you don't know what an interaction plot is, see p. 494 of Samuels et al. (2016). c. Briefly describe the interaction plot. d. Fit a two-way ANOVA model to the spruce moth data. Include the output in your assignment
Step by Step Solution
There are 3 Steps involved in it

Get step-by-step solutions from verified subject matter experts