

Question: If possible can you type your answer and post a screen shot of it so it is easier to read than hand-writing? If not that
 If possible can you type your answer and post a screen shot of it so it is easier to read than hand-writing? If not that is okay just have trouble with eye-sight and handwriting. Thank you for your time and expertise!
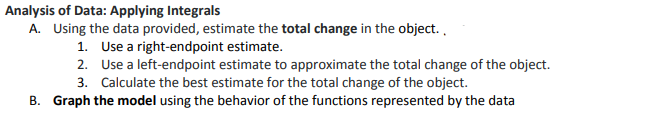
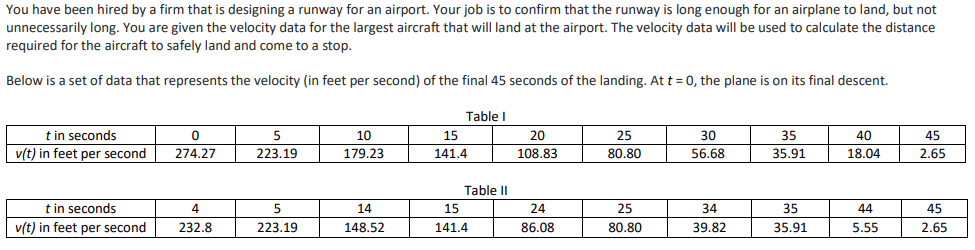
Analysis of Data: Applying Integrals A. Using the data provided, estimate the total change in the object. . 1. Use a right-endpoint estimate. 2. Use a left-endpoint estimate to approximate the total change of the object. 3. Calculate the best estimate for the total change of the object. B. Graph the model using the behavior of the functions represented by the data You have been hired by a firm that is designing a runway for an airport. Your job is to confirm that the runway is long enough for an airplane to land, but not unnecessarily long. You are given the velocity data for the largest aircraft that will land at the airport. The velocity data will be used to calculate the distance required for the aircraft to safely land and come to a stop. Below is a set of data that represents the velocity (in feet per second) of the final 45 seconds of the landing. At t = 0, the plane is on its final descent. t in seconds v(t) in feet per second 0 274.27 5 223.19 10 179.23 Table ! 15 141.4 20 108.83 25 80.80 30 56.68 35 35.91 40 18.04 45 2.65 5 t in seconds v(t) in feet per second 45 4 232.8 Table 11 15 141.4 14 148.52 24 86.08 25 80.80 34 39.82 35 35.91 44 5.55 223.19 2.65 Analysis of Data: Applying Integrals A. Using the data provided, estimate the total change in the object. . 1. Use a right-endpoint estimate. 2. Use a left-endpoint estimate to approximate the total change of the object. 3. Calculate the best estimate for the total change of the object. B. Graph the model using the behavior of the functions represented by the data You have been hired by a firm that is designing a runway for an airport. Your job is to confirm that the runway is long enough for an airplane to land, but not unnecessarily long. You are given the velocity data for the largest aircraft that will land at the airport. The velocity data will be used to calculate the distance required for the aircraft to safely land and come to a stop. Below is a set of data that represents the velocity (in feet per second) of the final 45 seconds of the landing. At t = 0, the plane is on its final descent. t in seconds v(t) in feet per second 0 274.27 5 223.19 10 179.23 Table ! 15 141.4 20 108.83 25 80.80 30 56.68 35 35.91 40 18.04 45 2.65 5 t in seconds v(t) in feet per second 45 4 232.8 Table 11 15 141.4 14 148.52 24 86.08 25 80.80 34 39.82 35 35.91 44 5.55 223.19 2.65
Step by Step Solution
There are 3 Steps involved in it

Get step-by-step solutions from verified subject matter experts