

Question: If the empirical rules apply here, between which two numbers can you be about 68% sure that the salary of any one of these 200
 If the empirical rules apply here, between which two numbers can you be about 68% sure that the salary of any one of these 200 students will fall? Round your answers to the nearest whole dollar, if necessary.
Between $_______ & $_______
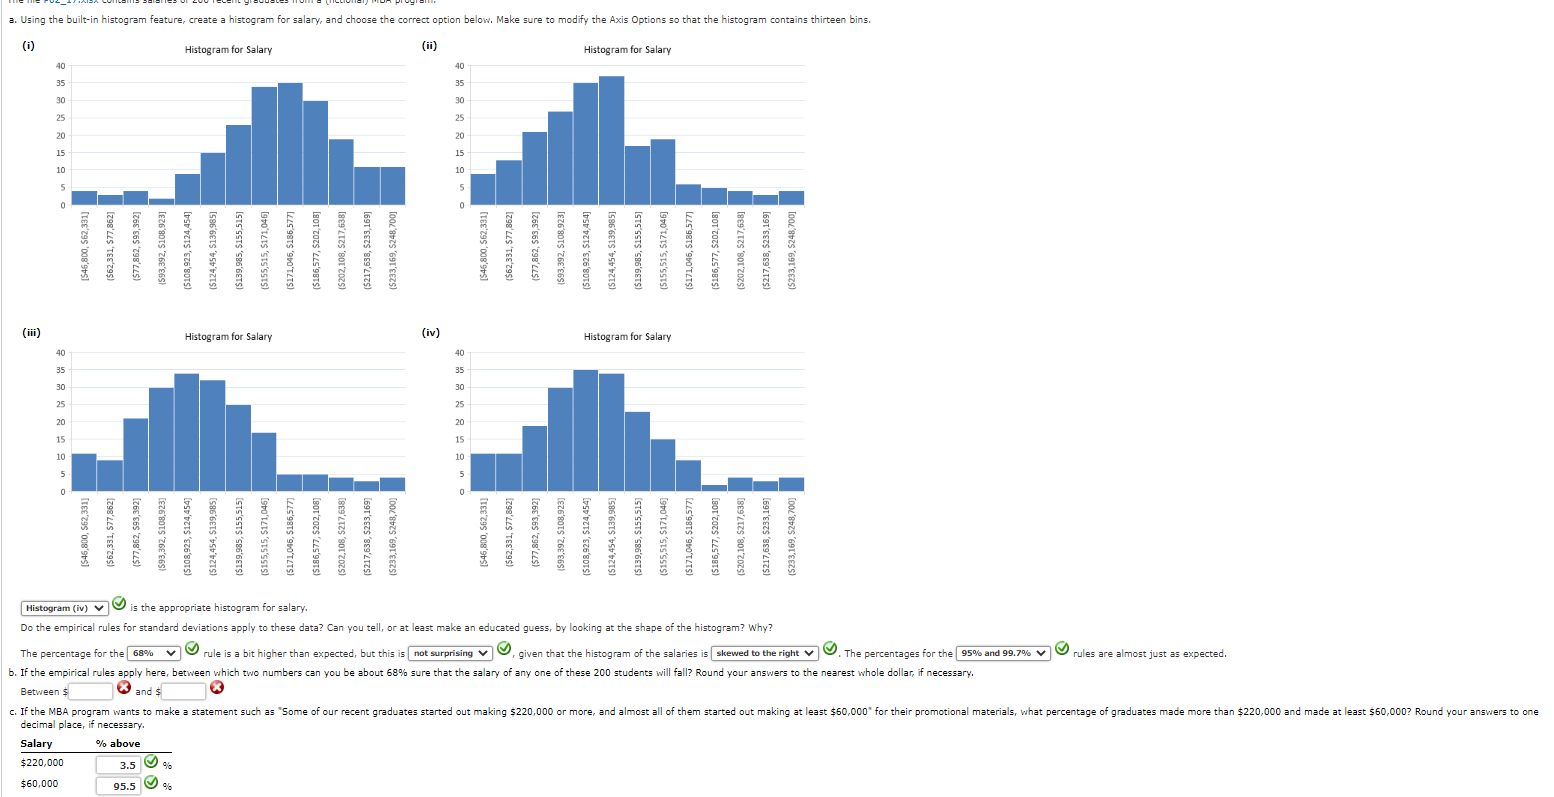
a. Using the built-in histogram feature, create a histogram for salary, and choose the correct option below. Make sure to modify the Axis Options so that the histogram contains thirteen bins. (i) Histogram for Salary (iii) 40 35 30 25 20 15 10 5 0 40 35 30 25 20 15 10 5 0 [$46,800, $62,331] ($62,331, $77,862] $77,862, $93,392] $93,392, $108,923] [$46,800, 562,331) ($62,331, $77,862] ($77,862, 593,392] ($93,392, $108,923] $108,923, $124,454] ($124,454, $139,985) 3.5 $108,923, $124,454] 95.5 ($124,454, $139,985) ($139,985, $155,515) Histogram (iv) is histogram for salary. Do the empirical rules for standard deviations apply to these data? Can you tell, the appropriate A Histogram for Salary $217,638] ($155,515, $171,046] ($171,046, $186,577] ($186,577, $202,108] $217,638, $233,169] (5202,108, (5233,169, 5248,700] % ($139,985, $155,515) $155,515, $171,046) ($171,046, $186,577] ($186,577, $202,108] (5202,108, $217,638) ($217,638, $233,169) (5233,169, 5248,700) (ii) (iv) 40 35 30 25 20 15 10 5 0 40 35 30 25 20 15 10 5 0 [$46,800, $62,331] $62,331, $77,862] ($77,862, $93,392] $93,392, $108,923] Histogram for Salary or at least make an educated $108,923, $124,454] ($124,454, $139,985] 139,985, $155,515] 155,515, $171,046) Histogram for Salary $46,800, 562,331] ($62,331, $77,862] $77,862, $93,392] 593,392, $108,923] $108,923, $124,454] $124,454, $139,985] ($139,985, $155,515) 5155,515, $171,046) 171,046, $186,577] The percentage for the 68% b. If the empirical rules apply here, between which two numbers can you be about 68% sure that the salary of any one of these 200 students will fall? Round your answers to the nearest whole dollar, if necessary. Between $ and $ $186,577, $202,108] $202,108, $217,638] ($217,638, $233,169) (5233,169,5248,700) guess, by looking at the shape of the histogram? Why? rule is a bit higher than expected, but this is not surprising, given that the histogram of the salaries is skewed to the right. The percentages for the [95% and 99.7% . The percentages for the [95% 99.7% rules are almost just as expected. and c. If the MBA program wants to make a statement such as "Some of our recent graduates started out making $220,000 or more, and almost all of them started out making at least $60,000 for their promotional materials, what percentage of graduates made more than $220,000 and made at least $60,000? Round your answers to one decimal place, if necessary. Salary % above $220,000 $60,000 a. Using the built-in histogram feature, create a histogram for salary, and choose the correct option below. Make sure to modify the Axis Options so that the histogram contains thirteen bins. (i) Histogram for Salary (iii) 40 35 30 25 20 15 10 5 0 40 35 30 25 20 15 10 5 0 [$46,800, $62,331] ($62,331, $77,862] $77,862, $93,392] $93,392, $108,923] [$46,800, 562,331) ($62,331, $77,862] ($77,862, 593,392] ($93,392, $108,923] $108,923, $124,454] ($124,454, $139,985) 3.5 $108,923, $124,454] 95.5 ($124,454, $139,985) ($139,985, $155,515) Histogram (iv) is histogram for salary. Do the empirical rules for standard deviations apply to these data? Can you tell, the appropriate A Histogram for Salary $217,638] ($155,515, $171,046] ($171,046, $186,577] ($186,577, $202,108] $217,638, $233,169] (5202,108, (5233,169, 5248,700] % ($139,985, $155,515) $155,515, $171,046) ($171,046, $186,577] ($186,577, $202,108] (5202,108, $217,638) ($217,638, $233,169) (5233,169, 5248,700) (ii) (iv) 40 35 30 25 20 15 10 5 0 40 35 30 25 20 15 10 5 0 [$46,800, $62,331] $62,331, $77,862] ($77,862, $93,392] $93,392, $108,923] Histogram for Salary or at least make an educated $108,923, $124,454] ($124,454, $139,985] 139,985, $155,515] 155,515, $171,046) Histogram for Salary $46,800, 562,331] ($62,331, $77,862] $77,862, $93,392] 593,392, $108,923] $108,923, $124,454] $124,454, $139,985] ($139,985, $155,515) 5155,515, $171,046) 171,046, $186,577] The percentage for the 68% b. If the empirical rules apply here, between which two numbers can you be about 68% sure that the salary of any one of these 200 students will fall? Round your answers to the nearest whole dollar, if necessary. Between $ and $ $186,577, $202,108] $202,108, $217,638] ($217,638, $233,169) (5233,169,5248,700) guess, by looking at the shape of the histogram? Why? rule is a bit higher than expected, but this is not surprising, given that the histogram of the salaries is skewed to the right. The percentages for the [95% and 99.7% . The percentages for the [95% 99.7% rules are almost just as expected. and c. If the MBA program wants to make a statement such as "Some of our recent graduates started out making $220,000 or more, and almost all of them started out making at least $60,000 for their promotional materials, what percentage of graduates made more than $220,000 and made at least $60,000? Round your answers to one decimal place, if necessary. Salary % above $220,000 $60,000
Step by Step Solution
There are 3 Steps involved in it

Get step-by-step solutions from verified subject matter experts