

Question: If the project's performance is expressed by this graph, which of the following could be a possible explanation of the project's performance? The estimates used
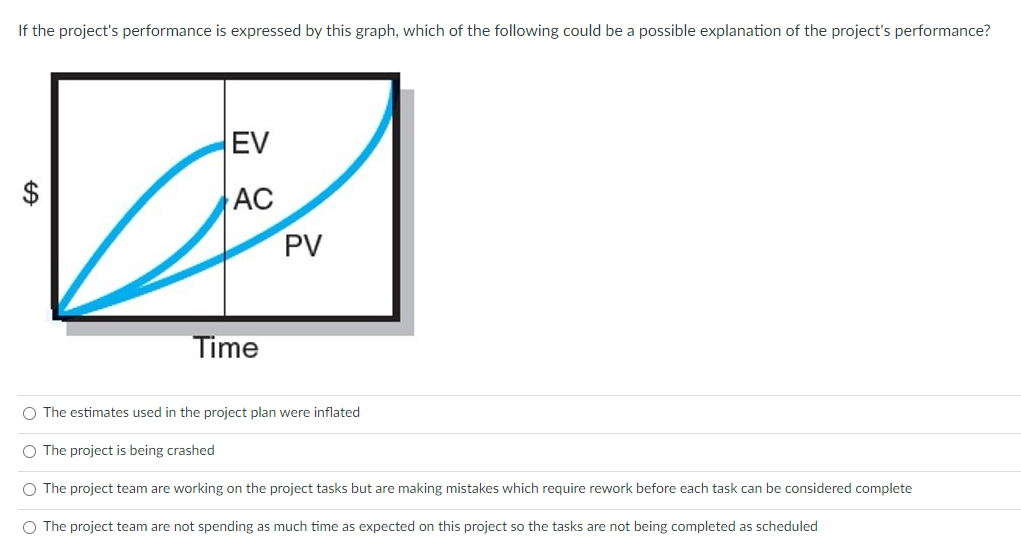
If the project's performance is expressed by this graph, which of the following could be a possible explanation of the project's performance? The estimates used in the project plan were inflated The project is being crashed The project team are working on the project tasks but are making mistakes which require rework before each task can be considered complete The project team are not spending as much time as expected on this project so the tasks are not being completed as scheduled
Step by Step Solution
There are 3 Steps involved in it
1 Expert Approved Answer
Step: 1 Unlock

Question Has Been Solved by an Expert!
Get step-by-step solutions from verified subject matter experts
Step: 2 Unlock
Step: 3 Unlock