

Question: IF TOO LONG, PLEASE PUT THE REST IN THE COMMENT SECTION Financial Analysis Case 1 - Under Armour Search Google or any other search engine
IF TOO LONG, PLEASE PUT THE REST IN THE COMMENT SECTION
Financial Analysis Case 1 - Under Armour
Search Google or any other search engine to help you better understand the business at Under Armour.
Then read Under Armour's 2016 Annual Report, found in this Module.
As the Chief Financial Officer at Under Armour, what are your recommendations to improve the financial health of the company? Discuss at length. Be thorough in your analysis and write-up.
Your analysis must begin with a horizontal analysis and a common size analysis. Then calculate the ratios from the liquidity, activity, leverage, profitability and stock market groups of ratios, as outlined in our chapter.
It is recommended you use Excel for the horizontal analysis and common size analysis, as well as your ratio calculations.
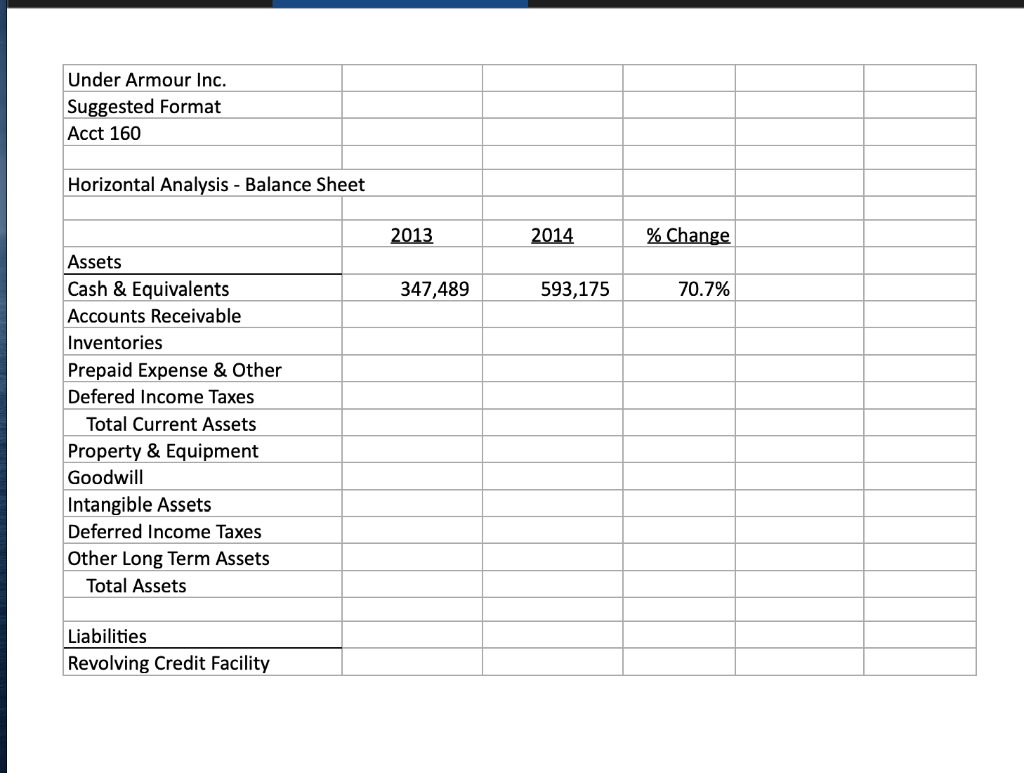
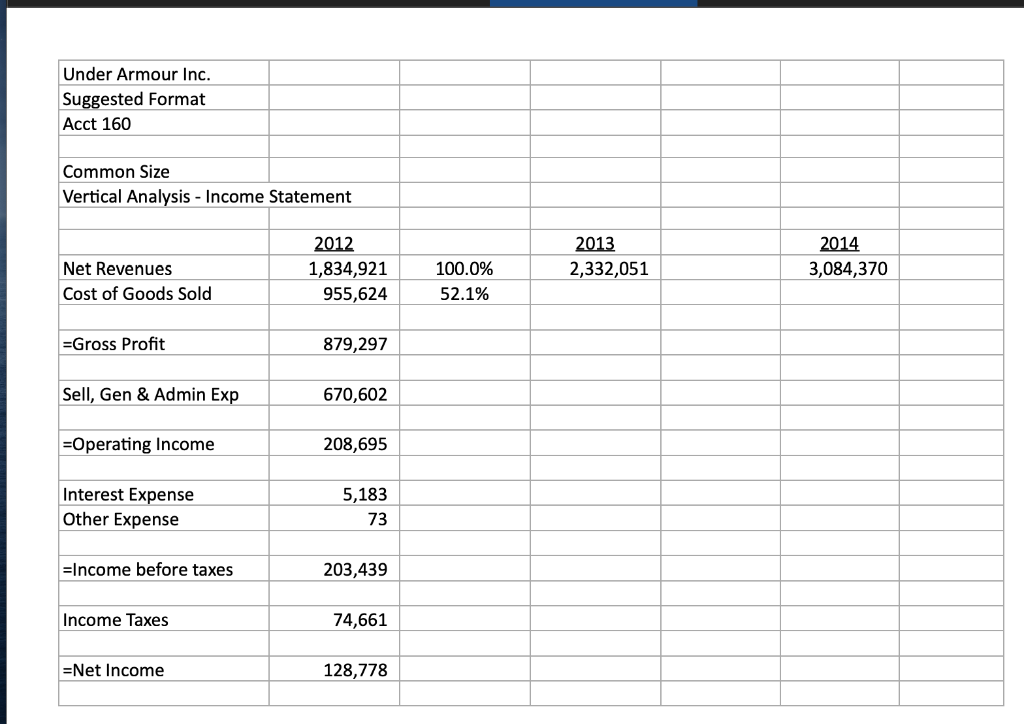
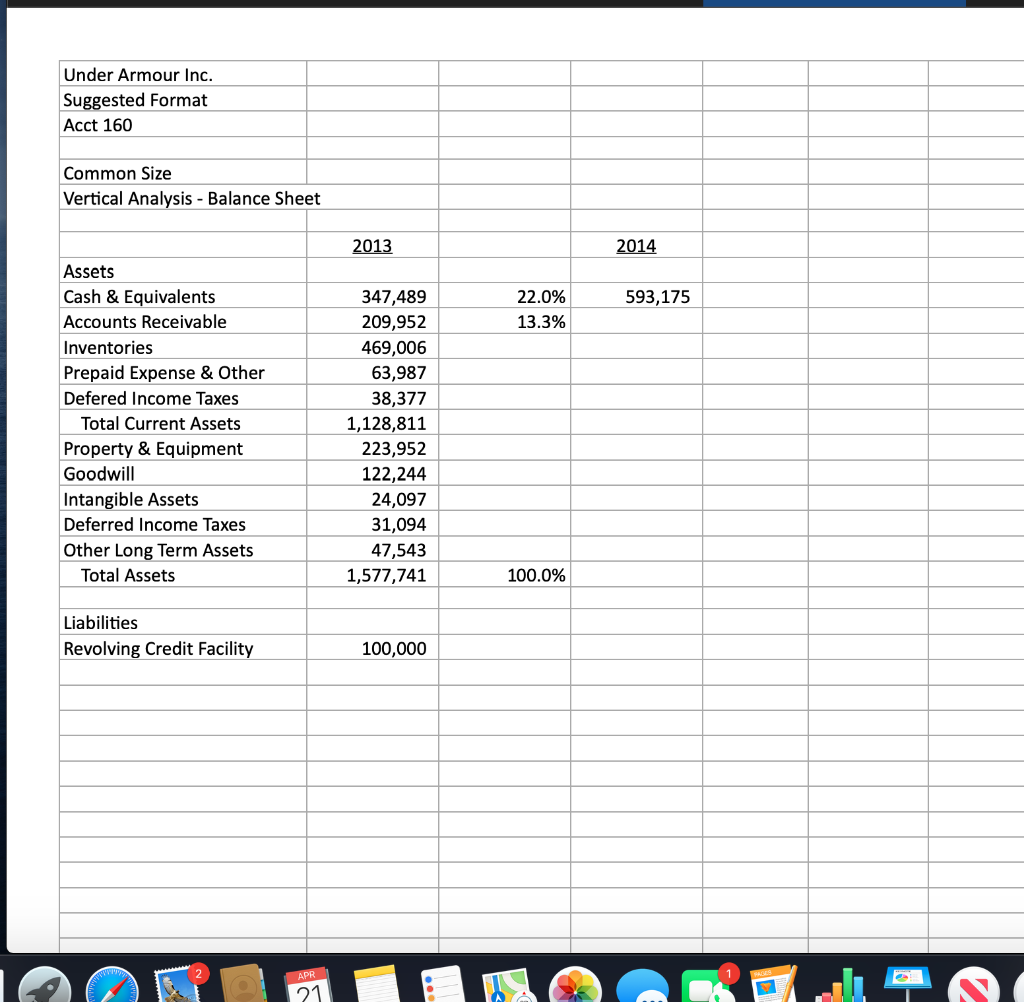
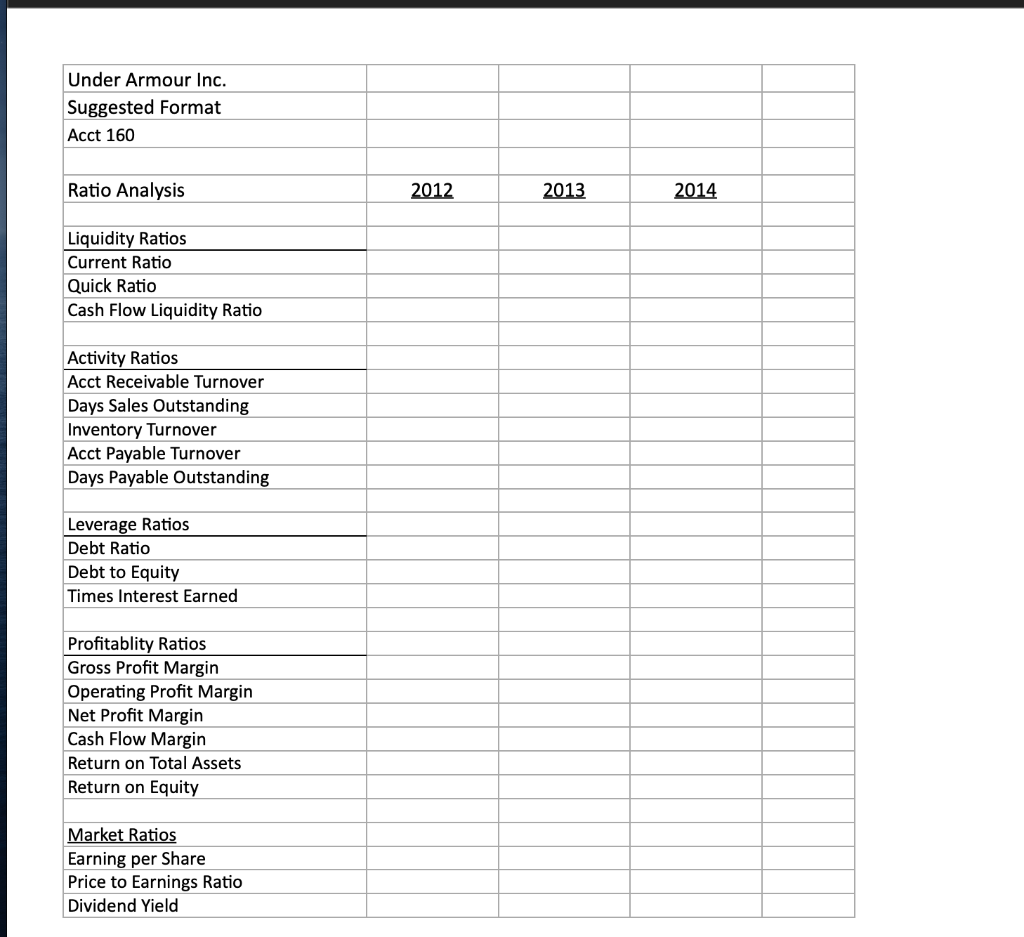
Under Armour Inc. Suggested Format Horizontal Analysis - Balance Sheet 2013 2014 % Change 347,489 593,175 70.7% Assets Cash & Equivalents Accounts Receivable Inventories Prepaid Expense & Other Total Current Assets Property & Equipment Goodwill Intangible Assets Deferred Income Taxes Other Long Term Assets Total Assets Liabilities Revolving Credit Facility Under Armour Inc. Suggested Format Acct 160 Common Size Vertical Analysis - Income Statement 2012 2013 2,332,051 2014 3,084,370 Net Revenues Cost of Goods Sold 100.0% 52.1% 955,624 =Gross Profit 879,297 Sell, Gen & Admin Exp 670,602 =Operating Income 208,695 Interest Expense 5,183 73 =Income before taxes 203,439 74,661 =Net Income 128,778 Under Armour Inc. Suggested Format Acct 160 Common Size Vertical Analysis - Balance Sheet 2014 593,175 13.3% Assets Cash & Equivalents Accounts Receivable Inventories Prepaid Expense & Other Defered Income Taxes Total Current Assets Property & Equipment Goodwill Intangible Assets Deferred Income Taxes Other Long Term Assets Total Assets 347,489 209,952 469,006 63,987 38,377 1,128,811 223,952 122,244 24,097 31,094 47,543 1,577,741 100.0% Liabilities Revolving Credit Facility 100,000 Suggested Format Acct 160 Ratio Analysis 2012 2013 2014 Liquidity Ratios Current Ratio Quick Ratio Cash Flow Liquidity Ratio Activity Ratios Acct Receivable Turnover Days Sales Outstanding Acct Payable Turnover Days Payable Outstanding Leverage Ratios Debt Ratio Debt to Equity Times Interest Earned Profitablity Ratios Gross Profit Margin Operating Profit Margin Net Profit Margin Cash Flow Margin Return on Total Assets Return on Equity Market Ratios Earning per Share Price to Earnings Ratio Dividend Yield Under Armour Inc. Suggested Format Horizontal Analysis - Balance Sheet 2013 2014 % Change 347,489 593,175 70.7% Assets Cash & Equivalents Accounts Receivable Inventories Prepaid Expense & Other Total Current Assets Property & Equipment Goodwill Intangible Assets Deferred Income Taxes Other Long Term Assets Total Assets Liabilities Revolving Credit Facility Under Armour Inc. Suggested Format Acct 160 Common Size Vertical Analysis - Income Statement 2012 2013 2,332,051 2014 3,084,370 Net Revenues Cost of Goods Sold 100.0% 52.1% 955,624 =Gross Profit 879,297 Sell, Gen & Admin Exp 670,602 =Operating Income 208,695 Interest Expense 5,183 73 =Income before taxes 203,439 74,661 =Net Income 128,778 Under Armour Inc. Suggested Format Acct 160 Common Size Vertical Analysis - Balance Sheet 2014 593,175 13.3% Assets Cash & Equivalents Accounts Receivable Inventories Prepaid Expense & Other Defered Income Taxes Total Current Assets Property & Equipment Goodwill Intangible Assets Deferred Income Taxes Other Long Term Assets Total Assets 347,489 209,952 469,006 63,987 38,377 1,128,811 223,952 122,244 24,097 31,094 47,543 1,577,741 100.0% Liabilities Revolving Credit Facility 100,000 Suggested Format Acct 160 Ratio Analysis 2012 2013 2014 Liquidity Ratios Current Ratio Quick Ratio Cash Flow Liquidity Ratio Activity Ratios Acct Receivable Turnover Days Sales Outstanding Acct Payable Turnover Days Payable Outstanding Leverage Ratios Debt Ratio Debt to Equity Times Interest Earned Profitablity Ratios Gross Profit Margin Operating Profit Margin Net Profit Margin Cash Flow Margin Return on Total Assets Return on Equity Market Ratios Earning per Share Price to Earnings Ratio Dividend Yield
Step by Step Solution
There are 3 Steps involved in it

Get step-by-step solutions from verified subject matter experts