

Question: If unable to answer questions, please note the formulas needed for each situation! Thanks! You have recently come into a little money and have decided
If unable to answer questions, please note the formulas needed for each situation! Thanks!
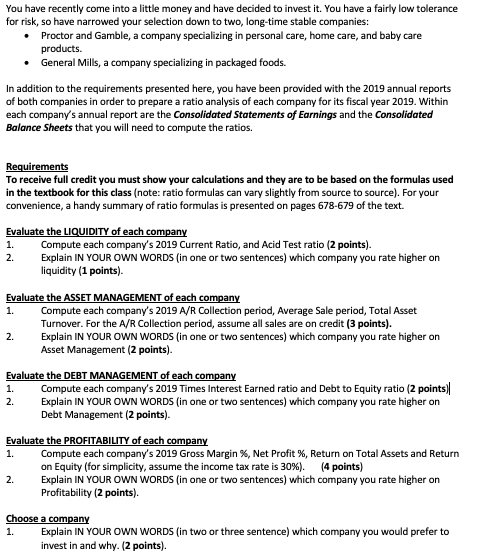
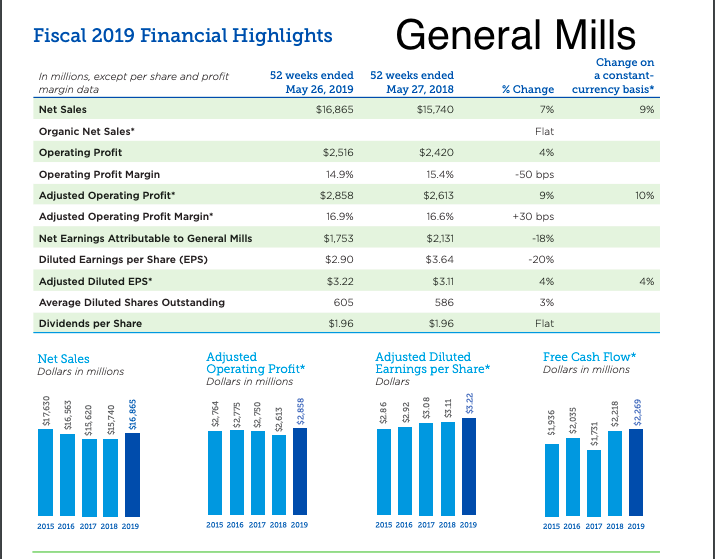
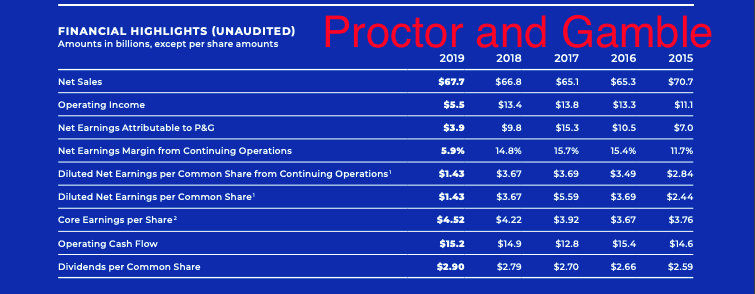
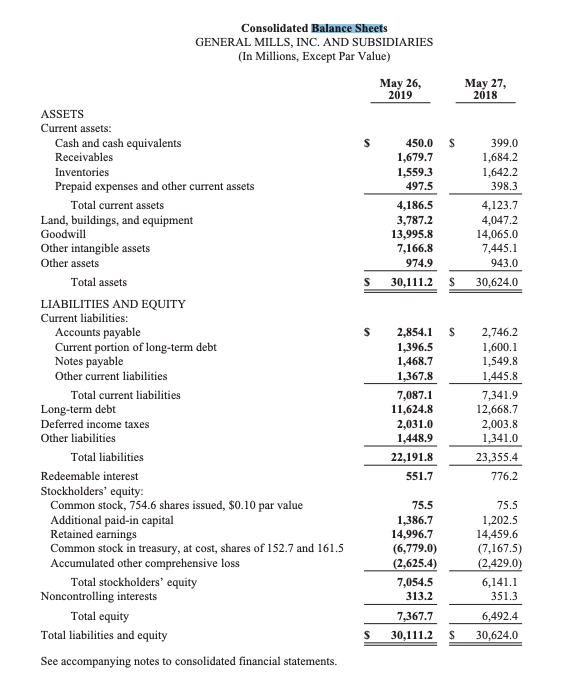
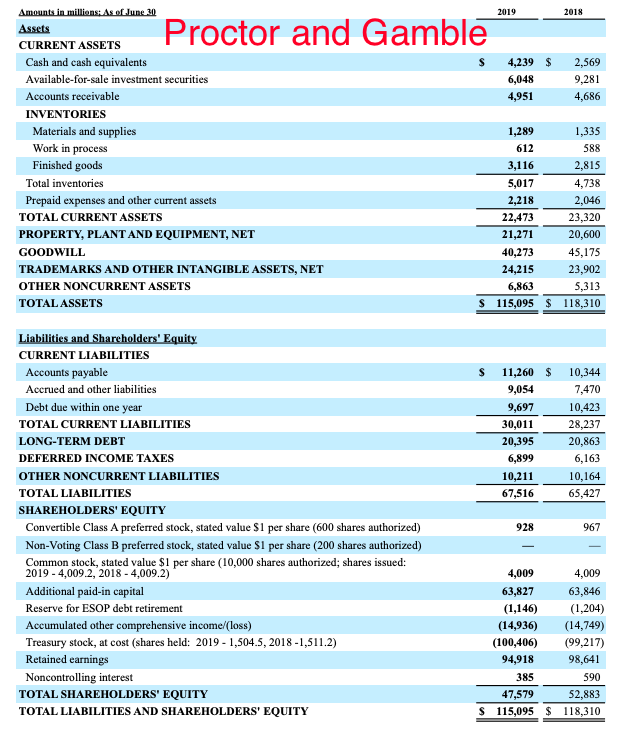
You have recently come into a little money and have decided to invest it. You have a fairly low tolerance for risk, so have narrowed your selection down to two, long-time stable companies: Proctor and Gamble, a company specializing in personal care, home care, and baby care products. General Mills, a company specializing in packaged foods. In addition to the requirements presented here, you have been provided with the 2019 annual reports of both companies in order to prepare a ratio analysis of each company for its fiscal year 2019. Within each company's annual report are the Consolidated Statements of Earnings and the Consolidated Balance Sheets that you will need to compute the ratios. Requirements To receive full credit you must show your calculations and they are to be based on the formulas used in the textbook for this class (note: ratio formulas can vary slightly from source to source). For your convenience, a handy summary of ratio formulas is presented on pages 678-679 of the text. Evaluate the LIQUIDITY of each company Compute each company's 2019 Current Ratio, and Acid Test ratio (2 points). 2. Explain IN YOUR OWN WORDS (in one or two sentences) which company you rate higher on liquidity (1 points) Evaluate the ASSET MANAGEMENT of each company Compute each company's 2019 A/R Collection period, Average Sale period, Total Asset Turnover. For the A/R Collection period, assume all sales are on credit (3 points). 2. Explain IN YOUR OWN WORDS (in one or two sentences) which company you rate higher on Asset Management (2 points) Evaluate the DEBT MANAGEMENT of each company Compute each company's 2019 Times Interest Earned ratio and Debt to Equity ratio (2 points) 2. Explain IN YOUR OWN WORDS (in one or two sentences) which company you rate higher on Debt Management (2 points) Evaluate the PROFITABILITY of each company 1. Compute each company's 2019 Gross Margin %, Net Profit %, Return on Total Assets and Return on Equity (for simplicity, assume the income tax rate is 30%). (4 points) Explain IN YOUR OWN WORDS (in one or two sentences) which company you rate higher on Profitability (2 points). 2 Choose a company Explain IN YOUR OWN WORDS (in two or three sentence) which company you would prefer to invest in and why. (2 points). Fiscal 2019 Financial Highlights In millions, except per share and profit margin data 52 weeks ended May 26, 2019 $16,865 52 weeks ended May 27, 2018 $15,740 % Change 7% Change on a constant- currency basis 9% Net Sales Flat $2,516 $2,420 4% 14.9% Organic Net Sales Operating Profit Operating Profit Margin Adjusted Operating Profit Adjusted Operating Profit Margin* Net Earnings Attributable to General Mills Diluted Earnings per Share (EPS) 15.4% $2,613 $2,858 10% -50 bps 9% +30 bps -18% 16.9% 16.6% $1,753 $2.131 $3.64 -20% Adjusted Diluted EPS* $3.11 4% 4% $2.90 $3.22 605 $1.96 586 3% Average Diluted Shares Outstanding Dividends per Share $1.96 Flat Net Sales Dollars in millions Adjusted Operating Profit* Dollars in millions Adjusted Diluted Earnings per Share* Dollars Free Cash Flow* Dollars in millions $17,630 $16,563 $15,620 12 $16,865 12 12 $15,740 9567$ $2,035 $2,218 $2,269 $1,731 2015 2016 2017 2018 2019 2015 2016 2017 2018 2019 2015 2016 2017 2018 2019 2015 2016 2017 2018 2019 FINANCIAL HIGHLIGHTS (UNAUDITED) Amounts in billions, except per share amounts Proctor and Gamble 2019 2018 Net Sales $67.7 Operating Income 2017 $65.1 $13.8 $15.3 15.7% $3.69 2015 $70.7 $11.1 $7. $66.8 $13.4 $9.8 14.8% $3.67 $5.5 $3.9 5.9% $1.43 2016 $65.3 $13.3 $10.5 15.4% $3.49 Net Earnings Attributable to P&G Net Earnings Margin from Continuing Operations 11.7% Diluted Net Earnings per Common Share from Continuing Operations $2.84 Diluted Net Earnings per Common Share $1.43 $3.67 $5.59 $3.69 $2.44 Core Earnings per Share $4.52 $4.22 $3.92 $3.67 $3.76 Operating Cash Flow $15.2 $14.9 $12.8 $15.4 $14.6 Dividends per Common Share $2.90 $2.79 $2.70 $2.66 $2.59 Consolidated Balance Sheets GENERAL MILLS, INC. AND SUBSIDIARIES (In Millions, Except Par Value) May 26, 2019 May 27, 2018 $ 399.0 1,684.2 1,642.2 398.3 450.0 1,679.7 1,559.3 497.5 4,186.5 3,787.2 13,995.8 7,166.8 974.9 30,111.2 4,123.7 4,047.2 14.065.0 7,445.1 943.0 30,624.0 $ $ $ ASSETS Current assets: Cash and cash equivalents Receivables Inventories Prepaid expenses and other current assets Total current assets Land, buildings, and equipment Goodwill Other intangible assets Other assets Total assets LIABILITIES AND EQUITY Current liabilities: Accounts payable Current portion of long-term debt Notes payable Other current liabilities Total current liabilities Long-term debt Deferred income taxes Other liabilities Total liabilities Redeemable interest Stockholders' equity: Common stock, 754.6 shares issued, $0.10 par value Additional paid-in capital Retained earnings Common stock in treasury, at cost, shares of 152.7 and 161.5 Accumulated other comprehensive loss Total stockholders' equity Noncontrolling interests Total equity Total liabilities and equity 2,854.1 1,396.5 1,468.7 1,367.8 7,087.1 11,624.8 2,031.0 1,448.9 22,191.8 551.7 2,746.2 1.600.1 1,549.8 1,445.8 7,341.9 12,668.7 2,003.8 1,341.0 23,355.4 776.2 75.5 1,386.7 14,996.7 (6,779.0) (2,625.4) 7,054.5 313.2 7,367.7 30.111.2 75.5 1,202.5 14,459.6 (7,167.5) (2,429.0) 6,141.1 351.3 6,492.4 30,624.0 $ See accompanying notes to consolidated financial statements. 2019 2018 Proctor and Gamble S 4,239 $ 6,048 4,9514 2,569 9,281 ,686 Amounts in millions: As of June 30 Assets CURRENT ASSETS Cash and cash equivalents Available-for-sale investment securities Accounts receivable INVENTORIES Materials and supplies Work in process Finished goods Total inventories Prepaid expenses and other current assets TOTAL CURRENT ASSETS PROPERTY, PLANT AND EQUIPMENT, NET GOODWILL TRADEMARKS AND OTHER INTANGIBLE ASSETS, NET OTHER NONCURRENT ASSETS TOTAL ASSETS 1,289 612 3,116 5,017 2,218 22,473 21,271 40,273 24,215 6,863 115,095 1,335 588 2,815 4,738 2,046 23,320 20,600 45,175 23,902 5,313 118,310 $ $ $ $ 11,260 9,054 9,697 30,011 20,395 6,899 10,211 67,516 10,344 7,470 10,423 28,237 20,863 6,163 10,164 65,427 Liabilities and Shareholders' Equity CURRENT LIABILITIES Accounts payable Accrued and other liabilities Debt due within one year TOTAL CURRENT LIABILITIES LONG-TERM DEBT DEFERRED INCOME TAXES OTHER NONCURRENT LIABILITIES TOTAL LIABILITIES SHAREHOLDERS' EQUITY Convertible Class A preferred stock, stated value $1 per share (600 shares authorized) Non-Voting Class B preferred stock, stated value $1 per share (200 shares authorized) Common stock, stated value $1 per share (10,000 shares authorized; shares issued: 2019 - 4,009.2, 2018 - 4,009.2) Additional paid-in capital Reserve for ESOP debt retirement Accumulated other comprehensive income/loss) Treasury stock, at cost (shares held: 2019 - 1,504.5, 2018 -1,511.2) Retained earnings Noncontrolling interest TOTAL SHAREHOLDERS' EQUITY TOTAL LIABILITIES AND SHAREHOLDERS' EQUITY 928 967 4,009 63,827 (1,146) (14,936) (100,406) 94,918 385 47,579 115,095 4,009 63,846 (1,204) (14,749) (99,217) 98,641 590 52,883 118,310 $ $ You have recently come into a little money and have decided to invest it. You have a fairly low tolerance for risk, so have narrowed your selection down to two, long-time stable companies: Proctor and Gamble, a company specializing in personal care, home care, and baby care products. General Mills, a company specializing in packaged foods. In addition to the requirements presented here, you have been provided with the 2019 annual reports of both companies in order to prepare a ratio analysis of each company for its fiscal year 2019. Within each company's annual report are the Consolidated Statements of Earnings and the Consolidated Balance Sheets that you will need to compute the ratios. Requirements To receive full credit you must show your calculations and they are to be based on the formulas used in the textbook for this class (note: ratio formulas can vary slightly from source to source). For your convenience, a handy summary of ratio formulas is presented on pages 678-679 of the text. Evaluate the LIQUIDITY of each company Compute each company's 2019 Current Ratio, and Acid Test ratio (2 points). 2. Explain IN YOUR OWN WORDS (in one or two sentences) which company you rate higher on liquidity (1 points) Evaluate the ASSET MANAGEMENT of each company Compute each company's 2019 A/R Collection period, Average Sale period, Total Asset Turnover. For the A/R Collection period, assume all sales are on credit (3 points). 2. Explain IN YOUR OWN WORDS (in one or two sentences) which company you rate higher on Asset Management (2 points) Evaluate the DEBT MANAGEMENT of each company Compute each company's 2019 Times Interest Earned ratio and Debt to Equity ratio (2 points) 2. Explain IN YOUR OWN WORDS (in one or two sentences) which company you rate higher on Debt Management (2 points) Evaluate the PROFITABILITY of each company 1. Compute each company's 2019 Gross Margin %, Net Profit %, Return on Total Assets and Return on Equity (for simplicity, assume the income tax rate is 30%). (4 points) Explain IN YOUR OWN WORDS (in one or two sentences) which company you rate higher on Profitability (2 points). 2 Choose a company Explain IN YOUR OWN WORDS (in two or three sentence) which company you would prefer to invest in and why. (2 points). Fiscal 2019 Financial Highlights In millions, except per share and profit margin data 52 weeks ended May 26, 2019 $16,865 52 weeks ended May 27, 2018 $15,740 % Change 7% Change on a constant- currency basis 9% Net Sales Flat $2,516 $2,420 4% 14.9% Organic Net Sales Operating Profit Operating Profit Margin Adjusted Operating Profit Adjusted Operating Profit Margin* Net Earnings Attributable to General Mills Diluted Earnings per Share (EPS) 15.4% $2,613 $2,858 10% -50 bps 9% +30 bps -18% 16.9% 16.6% $1,753 $2.131 $3.64 -20% Adjusted Diluted EPS* $3.11 4% 4% $2.90 $3.22 605 $1.96 586 3% Average Diluted Shares Outstanding Dividends per Share $1.96 Flat Net Sales Dollars in millions Adjusted Operating Profit* Dollars in millions Adjusted Diluted Earnings per Share* Dollars Free Cash Flow* Dollars in millions $17,630 $16,563 $15,620 12 $16,865 12 12 $15,740 9567$ $2,035 $2,218 $2,269 $1,731 2015 2016 2017 2018 2019 2015 2016 2017 2018 2019 2015 2016 2017 2018 2019 2015 2016 2017 2018 2019 FINANCIAL HIGHLIGHTS (UNAUDITED) Amounts in billions, except per share amounts Proctor and Gamble 2019 2018 Net Sales $67.7 Operating Income 2017 $65.1 $13.8 $15.3 15.7% $3.69 2015 $70.7 $11.1 $7. $66.8 $13.4 $9.8 14.8% $3.67 $5.5 $3.9 5.9% $1.43 2016 $65.3 $13.3 $10.5 15.4% $3.49 Net Earnings Attributable to P&G Net Earnings Margin from Continuing Operations 11.7% Diluted Net Earnings per Common Share from Continuing Operations $2.84 Diluted Net Earnings per Common Share $1.43 $3.67 $5.59 $3.69 $2.44 Core Earnings per Share $4.52 $4.22 $3.92 $3.67 $3.76 Operating Cash Flow $15.2 $14.9 $12.8 $15.4 $14.6 Dividends per Common Share $2.90 $2.79 $2.70 $2.66 $2.59 Consolidated Balance Sheets GENERAL MILLS, INC. AND SUBSIDIARIES (In Millions, Except Par Value) May 26, 2019 May 27, 2018 $ 399.0 1,684.2 1,642.2 398.3 450.0 1,679.7 1,559.3 497.5 4,186.5 3,787.2 13,995.8 7,166.8 974.9 30,111.2 4,123.7 4,047.2 14.065.0 7,445.1 943.0 30,624.0 $ $ $ ASSETS Current assets: Cash and cash equivalents Receivables Inventories Prepaid expenses and other current assets Total current assets Land, buildings, and equipment Goodwill Other intangible assets Other assets Total assets LIABILITIES AND EQUITY Current liabilities: Accounts payable Current portion of long-term debt Notes payable Other current liabilities Total current liabilities Long-term debt Deferred income taxes Other liabilities Total liabilities Redeemable interest Stockholders' equity: Common stock, 754.6 shares issued, $0.10 par value Additional paid-in capital Retained earnings Common stock in treasury, at cost, shares of 152.7 and 161.5 Accumulated other comprehensive loss Total stockholders' equity Noncontrolling interests Total equity Total liabilities and equity 2,854.1 1,396.5 1,468.7 1,367.8 7,087.1 11,624.8 2,031.0 1,448.9 22,191.8 551.7 2,746.2 1.600.1 1,549.8 1,445.8 7,341.9 12,668.7 2,003.8 1,341.0 23,355.4 776.2 75.5 1,386.7 14,996.7 (6,779.0) (2,625.4) 7,054.5 313.2 7,367.7 30.111.2 75.5 1,202.5 14,459.6 (7,167.5) (2,429.0) 6,141.1 351.3 6,492.4 30,624.0 $ See accompanying notes to consolidated financial statements. 2019 2018 Proctor and Gamble S 4,239 $ 6,048 4,9514 2,569 9,281 ,686 Amounts in millions: As of June 30 Assets CURRENT ASSETS Cash and cash equivalents Available-for-sale investment securities Accounts receivable INVENTORIES Materials and supplies Work in process Finished goods Total inventories Prepaid expenses and other current assets TOTAL CURRENT ASSETS PROPERTY, PLANT AND EQUIPMENT, NET GOODWILL TRADEMARKS AND OTHER INTANGIBLE ASSETS, NET OTHER NONCURRENT ASSETS TOTAL ASSETS 1,289 612 3,116 5,017 2,218 22,473 21,271 40,273 24,215 6,863 115,095 1,335 588 2,815 4,738 2,046 23,320 20,600 45,175 23,902 5,313 118,310 $ $ $ $ 11,260 9,054 9,697 30,011 20,395 6,899 10,211 67,516 10,344 7,470 10,423 28,237 20,863 6,163 10,164 65,427 Liabilities and Shareholders' Equity CURRENT LIABILITIES Accounts payable Accrued and other liabilities Debt due within one year TOTAL CURRENT LIABILITIES LONG-TERM DEBT DEFERRED INCOME TAXES OTHER NONCURRENT LIABILITIES TOTAL LIABILITIES SHAREHOLDERS' EQUITY Convertible Class A preferred stock, stated value $1 per share (600 shares authorized) Non-Voting Class B preferred stock, stated value $1 per share (200 shares authorized) Common stock, stated value $1 per share (10,000 shares authorized; shares issued: 2019 - 4,009.2, 2018 - 4,009.2) Additional paid-in capital Reserve for ESOP debt retirement Accumulated other comprehensive income/loss) Treasury stock, at cost (shares held: 2019 - 1,504.5, 2018 -1,511.2) Retained earnings Noncontrolling interest TOTAL SHAREHOLDERS' EQUITY TOTAL LIABILITIES AND SHAREHOLDERS' EQUITY 928 967 4,009 63,827 (1,146) (14,936) (100,406) 94,918 385 47,579 115,095 4,009 63,846 (1,204) (14,749) (99,217) 98,641 590 52,883 118,310 $ $
Step by Step Solution
There are 3 Steps involved in it

Get step-by-step solutions from verified subject matter experts