

Question: . If we are flipping a coin, how large a proportion of heads do we need to get in order to claim evidence that the
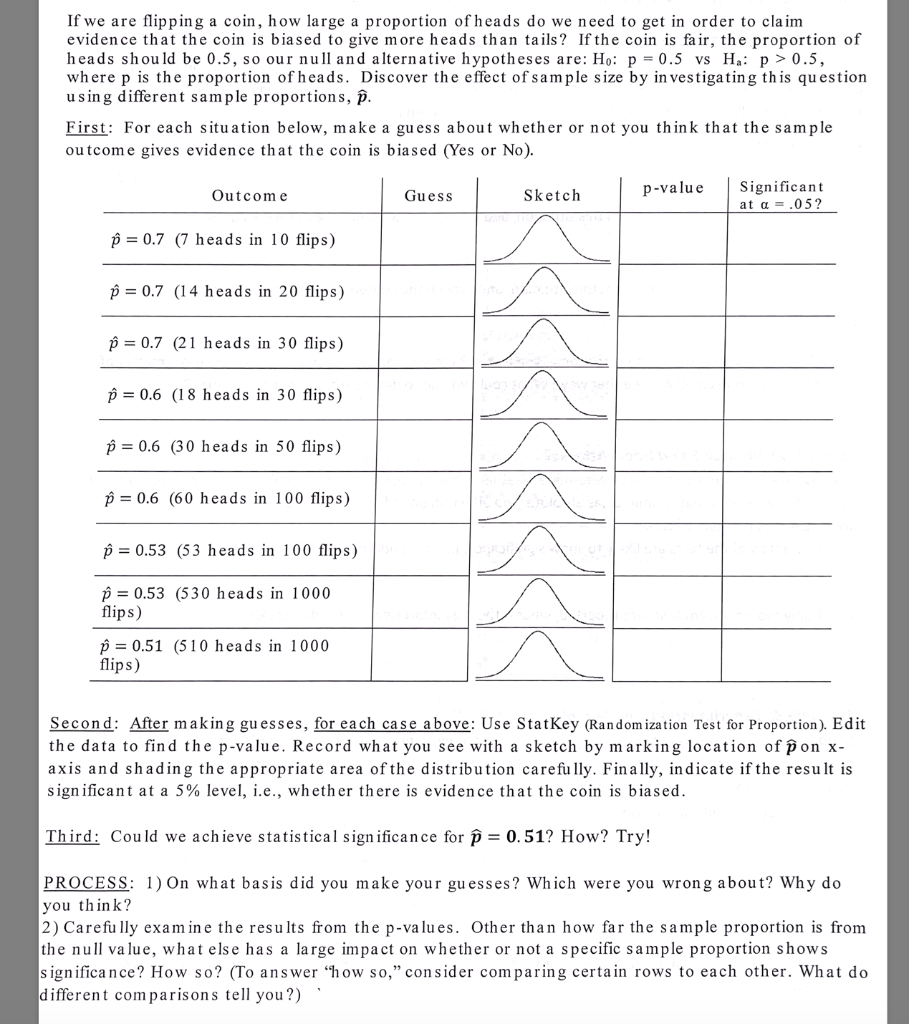
If we are flipping a coin, how large a proportion of heads do we need to get in order to claim evidence that the coin is biased to give more heads than tails? If the coin is fair, the proportion of heads should be 0.5, so our null and alternative hypotheses are: Ho: p = 0.5 vs Ha: p > 0.5, where p is the proportion of heads. Discover the effect of sample size by investigating this question using different sample proportions, p. First: For each situation below, make a guess about whether or not you think that the sample outcome gives evidence that the coin is biased (Yes or No). Outcome Guess Sketch p-value Significant at a .05? 0.7 (7 heads in 10 flips) p = 0.7 (14 heads in 20 flips) 0.7 (21 heads in 30 flips) 0.6 (18 heads in 30 flips) p = 0.6 (30 heads in 50 flips) p=0.6 (60 heads in 100 flips) p=0.53 (53 heads in 100 flips) p=0.53 (530 heads in 1000 flips) flips) 0.51 (510 heads in 1000 Second: After making guesses, for each case above: Use StatKey (Randomization Test for Proportion). Edit the data to find the p-value. Record what you see with a sketch by marking location of pon x- axis and shading the appropriate area of the distribution carefully. Finally, indicate if the result is significant at a 5% level, i.e., whether there is evidence that the coin is biased. Third: Could we achieve statistical significance for p = 0.51? How? Try! PROCESS: 1) On what basis did you make your guesses? Which were you wrong about? Why do you think? 2) Carefully examine the results from the p-values. Other than how far the sample proportion is from the null value, what else has a large impact on whether or not a specific sample proportion shows significance? How so? (To answer "how so," consider comparing certain rows to each other. What do different comparisons tell you?)
Step by Step Solution
There are 3 Steps involved in it

Get step-by-step solutions from verified subject matter experts