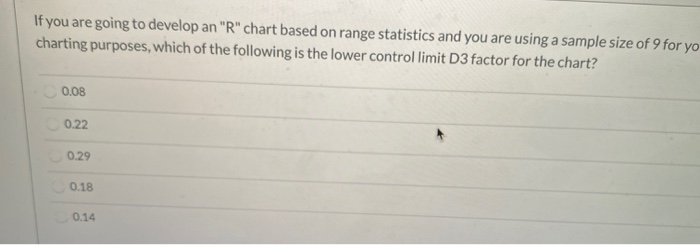
Question: If you are going to develop an R chart based on range statistics and you are using a sample size of 9 for yo charting

If you are going to develop an "R" chart based on
If you are going to develop an "R" chart based on range statistics and you are using a sample size of 9 for yo charting purposes, which of the following is the lower controllimit D3 factor for the chart? 0.08 0.22 0.29 0.18 0.14

Step by Step Solution

There are 3 Steps involved in it

1 Expert Approved Answer
Step: 1 Unlock blur-text-image
Question Has Been Solved by an Expert!

Get step-by-step solutions from verified subject matter experts

Step: 2 Unlock
Step: 3 Unlock

Students Have Also Explored These Related General Management Questions!