

Question: If you could explain to me how to interpret this data table? The hypothesis is true that less sleep can affect your academic performance, but
If you could explain to me how to interpret this data table? The hypothesis is true that less sleep can affect your academic performance, but I'm not sure how to read this to be able to prove it. Also what does "r" and "p" stand for? I think p may stand for probability. Thank you.
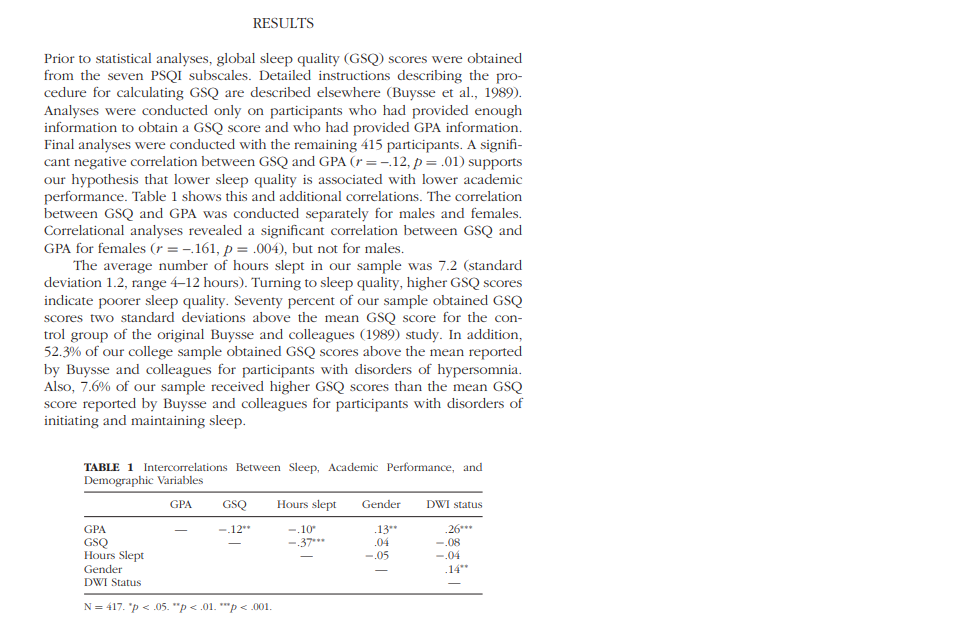
RESULTS Prior to statistical analyses, global sleep quality GSQ) scores were obtained from the seven PSQI subscales. Detailed instructions describing the pro- cedure for calculating GSQ are described elsewhere (Buysse et al., 1989). Analyses were conducted only on participants who had provided enough information to obtain a GSQ score and who had provided GPA information. Final analyses were conducted with the remaining 415 participants. A signifi- cant negative correlation between GSQ and GPA (r=-12, P=.01) supports our hypothesis that lower sleep quality is associated with lower academic performance. Table 1 shows this and additional correlations. The correlation between GSQ and GPA was conducted separately for males and females. Correlational analyses revealed a significant correlation between GSQ and GPA for females (r=-161, p = .004), but not for males. The average number of hours slept in our sample was 7.2 (standard deviation 1.2, range 412 hours). Turning to sleep quality, higher GSQ scores indicate poorer sleep quality. Seventy percent of our sample obtained GSQ scores two standard deviations above the mean GSQ score for the con- trol group of the original Buysse and colleagues (1989) study. In addition, 52.3% of our college sample obtained GSQ scores above the mean reported by Buysse and colleagues for participants with disorders of hypersomnia. Also, 7.6% of our sample received higher GSQ scores than the mean GSQ score reported by Buysse and colleagues for participants with disorders of initiating and maintaining sleep. GSQ TABLE 1 Intercorrelations Between Sleep, Academic Performance, and Demographic Variables GPA Hours slept Gender DWI status GPA -12** -.10 .13" -26 GSQ -.37 .04 -.08 Hours Slept -.05 -.04 Gender .14" DWI Status N= 417. *p<.05.>Step by Step Solution
There are 3 Steps involved in it
1 Expert Approved Answer
Step: 1 Unlock

Question Has Been Solved by an Expert!
Get step-by-step solutions from verified subject matter experts
Step: 2 Unlock
Step: 3 Unlock