

Question: If you could please do/post the excel solution that would be great! Number of Month January February March April May June Cabinets Produced 800 3,600
If you could please do/post the excel solution that would be great!
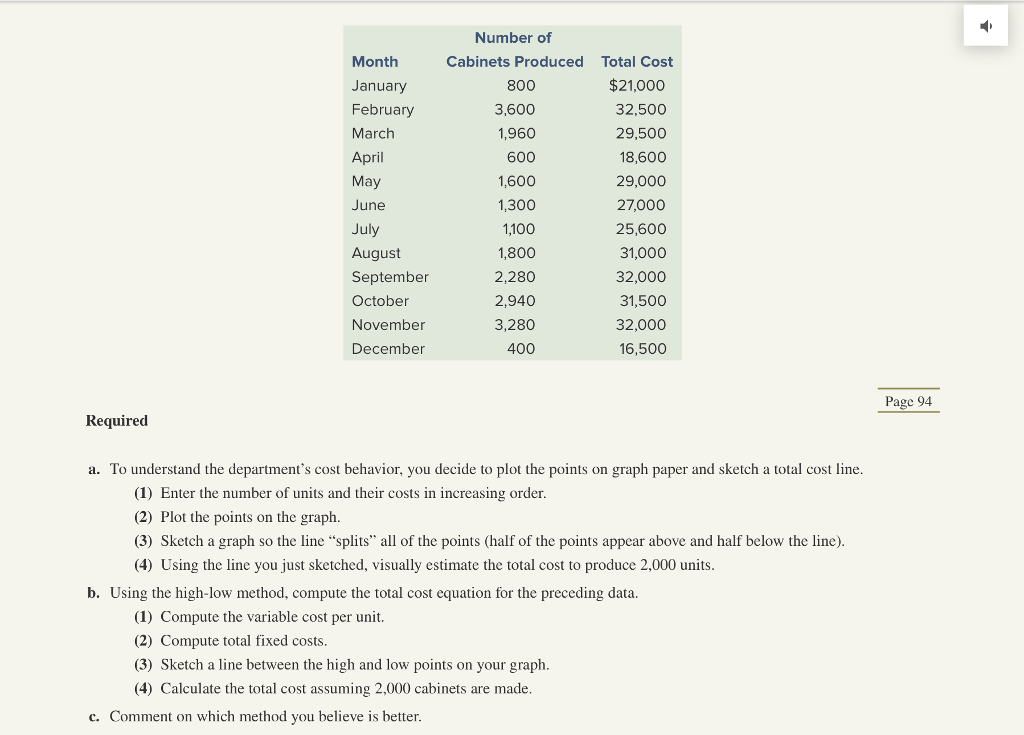
Number of Month January February March April May June Cabinets Produced 800 3,600 1,960 600 1,600 1,300 1,100 1,800 2,280 2,940 3,280 400 Total Cost $21,000 32,500 29,500 18,600 29,000 27,000 25,600 31,000 32,000 31,500 32,000 16,500 August September October November December Page 94 Required a. To understand the department's cost behavior, you decide to plot the points on graph paper and sketch a total cost line (1) Enter the number of units and their costs in increasing order (2) Plot the points on the graph. (3) Sketch a graph so the line "splits" all of the points (half of the points appear above and half below the line) (4) Using the line you just sketched, visually estimate the total cost to produce 2,000 units b. Using the high-low method, compute the total cost equation for the preceding data. (1) Compute the variable cost per unit. (2) Compute total fixed costs (3) Sketch a line between the high and low points on your graph (4) Calculate the total cost assuming 2,000 cabinets are made c. Comment on which method you believe is better Number of Month January February March April May June Cabinets Produced 800 3,600 1,960 600 1,600 1,300 1,100 1,800 2,280 2,940 3,280 400 Total Cost $21,000 32,500 29,500 18,600 29,000 27,000 25,600 31,000 32,000 31,500 32,000 16,500 August September October November December Page 94 Required a. To understand the department's cost behavior, you decide to plot the points on graph paper and sketch a total cost line (1) Enter the number of units and their costs in increasing order (2) Plot the points on the graph. (3) Sketch a graph so the line "splits" all of the points (half of the points appear above and half below the line) (4) Using the line you just sketched, visually estimate the total cost to produce 2,000 units b. Using the high-low method, compute the total cost equation for the preceding data. (1) Compute the variable cost per unit. (2) Compute total fixed costs (3) Sketch a line between the high and low points on your graph (4) Calculate the total cost assuming 2,000 cabinets are made c. Comment on which method you believe is better
Step by Step Solution
There are 3 Steps involved in it

Get step-by-step solutions from verified subject matter experts