

Question: If you could please show me your work that would be greatly appreciated. Thank you! The following table contains the historic returns from large stocks
If you could please show me your work that would be greatly appreciated. Thank you!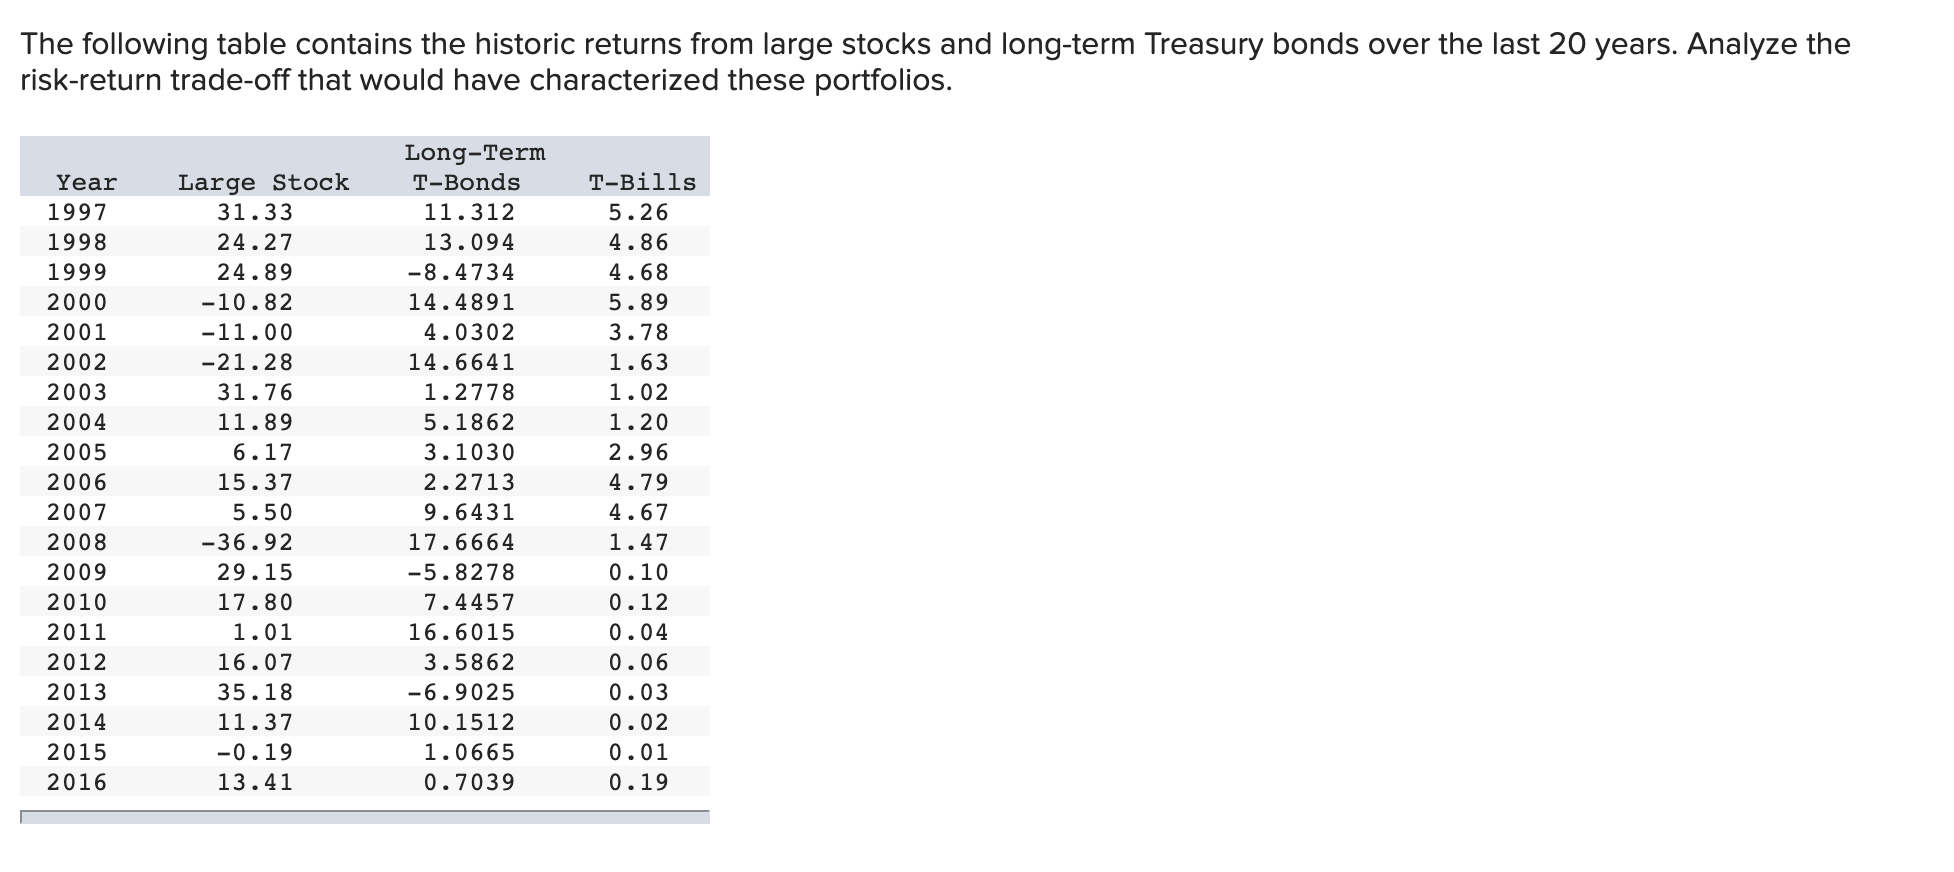
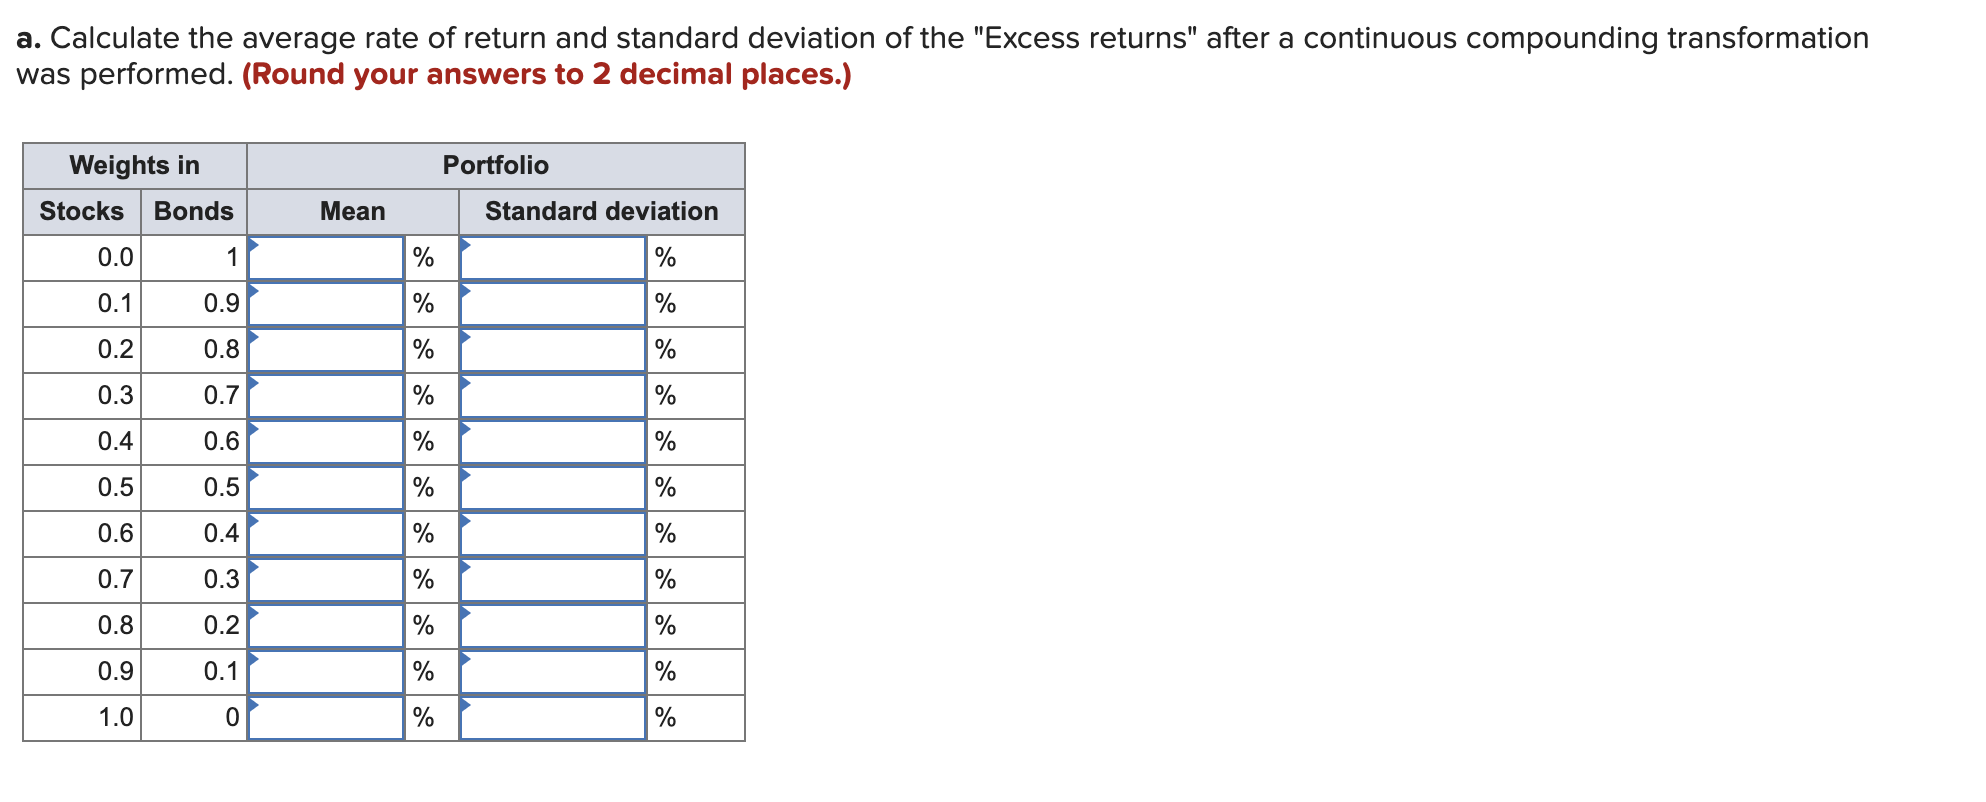
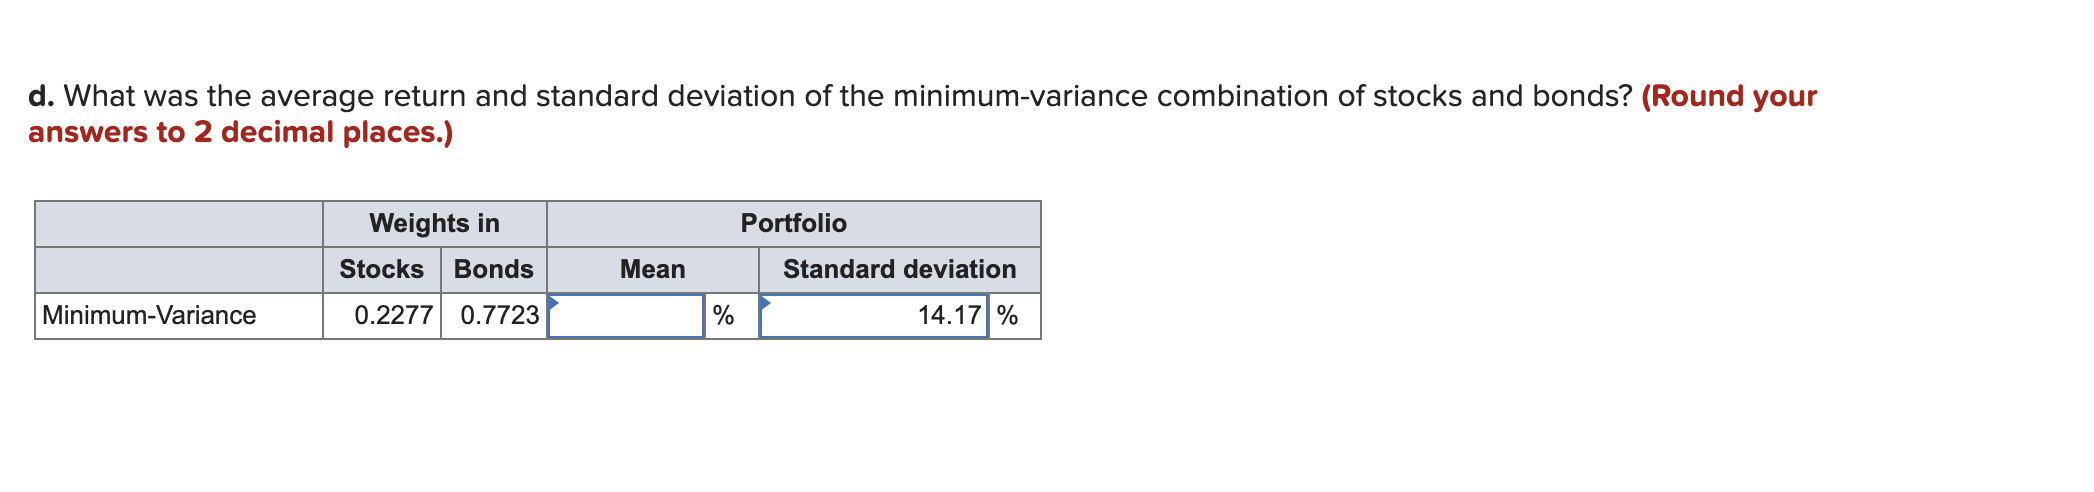
The following table contains the historic returns from large stocks and long-term Treasury bonds over the last 20 years. Analyze the risk-return trade-off that would have characterized these portfolios. Year 1997 1998 1999 2000 2001 2002 2003 2004 2005 2006 2007 2008 2009 2010 2011 2012 2013 2014 2015 2016 Large Stock 31.33 24.27 24.89 -10.82 -11.00 -21.28 31.76 11.89 6.17 15.37 5.50 - 36.92 29.15 17.80 1.01 16.07 35.18 11.37 -0.19 13.41 Long-Term T-Bonds 11.312 13.094 -8.4734 14.4891 4.0302 14.6641 1.2778 5.1862 3.1030 2.2713 9.6431 17.6664 -5.8278 7.4457 16.6015 3.5862 -6.9025 10.1512 1.0665 0.7039 T-Bills 5.26 4.86 4.68 5.89 3.78 1.63 1.02 1.20 2.96 4.79 4.67 1.47 0.10 0.12 0.04 0.06 0.03 0.02 0.01 0.19 a. Calculate the average rate of return and standard deviation of the "Excess returns" after a continuous compounding transformation was performed. (Round your answers to 2 decimal places.) Weights in Portfolio Stocks Bonds Mean Standard deviation 0.0 1 % % 0.1 0.9 % % 0.2 0.8 % % 0.3 0.7 % 0.4 0.6 % % 0.5 0.5 % 0.6 0.4 % % 0.7 0.3 % % 0.8 0.2 % % 0.9 0.1 % % 1.0 0 % d. What was the average return and standard deviation of the minimum-variance combination of stocks and bonds? (Round your answers to 2 decimal places.) Portfolio Weights in Stocks Bonds Mean Standard deviation Minimum-Variance 0.2277 0.7723 % 14.17% The following table contains the historic returns from large stocks and long-term Treasury bonds over the last 20 years. Analyze the risk-return trade-off that would have characterized these portfolios. Year 1997 1998 1999 2000 2001 2002 2003 2004 2005 2006 2007 2008 2009 2010 2011 2012 2013 2014 2015 2016 Large Stock 31.33 24.27 24.89 -10.82 -11.00 -21.28 31.76 11.89 6.17 15.37 5.50 - 36.92 29.15 17.80 1.01 16.07 35.18 11.37 -0.19 13.41 Long-Term T-Bonds 11.312 13.094 -8.4734 14.4891 4.0302 14.6641 1.2778 5.1862 3.1030 2.2713 9.6431 17.6664 -5.8278 7.4457 16.6015 3.5862 -6.9025 10.1512 1.0665 0.7039 T-Bills 5.26 4.86 4.68 5.89 3.78 1.63 1.02 1.20 2.96 4.79 4.67 1.47 0.10 0.12 0.04 0.06 0.03 0.02 0.01 0.19 a. Calculate the average rate of return and standard deviation of the "Excess returns" after a continuous compounding transformation was performed. (Round your answers to 2 decimal places.) Weights in Portfolio Stocks Bonds Mean Standard deviation 0.0 1 % % 0.1 0.9 % % 0.2 0.8 % % 0.3 0.7 % 0.4 0.6 % % 0.5 0.5 % 0.6 0.4 % % 0.7 0.3 % % 0.8 0.2 % % 0.9 0.1 % % 1.0 0 % d. What was the average return and standard deviation of the minimum-variance combination of stocks and bonds? (Round your answers to 2 decimal places.) Portfolio Weights in Stocks Bonds Mean Standard deviation Minimum-Variance 0.2277 0.7723 % 14.17%
Step by Step Solution
There are 3 Steps involved in it

Get step-by-step solutions from verified subject matter experts