

Question: If your sample size is 7, X-double- bar is 15.39, and R-bar is 0.4, compute the control limits for an X-bar chart What is
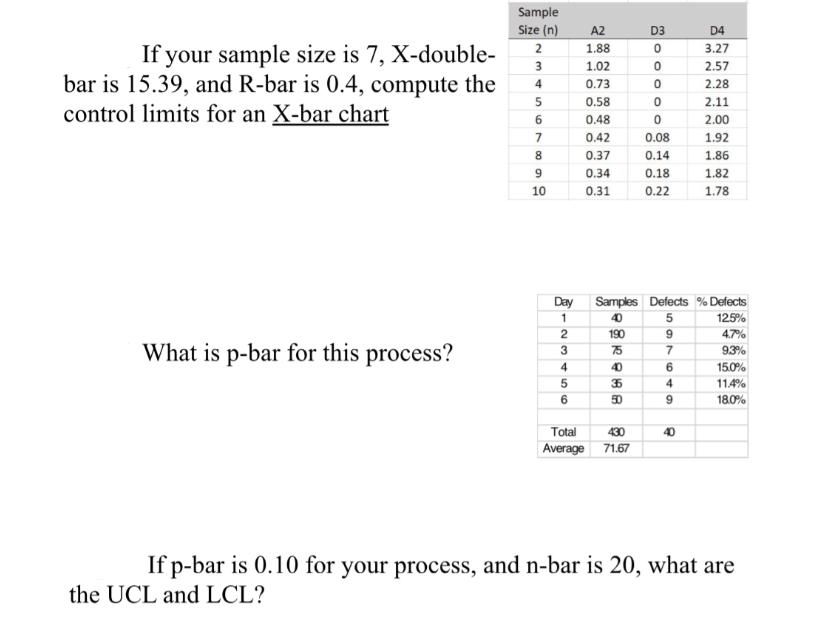
If your sample size is 7, X-double- bar is 15.39, and R-bar is 0.4, compute the control limits for an X-bar chart What is p-bar for this process? Sample Size (n) 2 3 4 5 6 7 059 8 10 8123456 Day A2 1.88 1.02 0.73 0.58 0.48 0.42 0.37 0.34 0.31 190 75 40 36 50 D3 430 Total Average 71.67 ooooo 0 Samples Defects % Defects 40 12.5% 4.7% 9.3% 15.0% 11.4% 18.0% 0 0.08 0.14 0.18 0.22 597649 D4 3.27 2.57 2.28 2.11 2.00 1.92 1.86 1.82 1.78 40 If p-bar is 0.10 for your process, and n-bar is 20, what are the UCL and LCL?
Step by Step Solution
3.45 Rating (155 Votes )
There are 3 Steps involved in it
SOLUTION To compute the control limits for an Xbar chart we can use ... View full answer

Get step-by-step solutions from verified subject matter experts