

Question: IFC / PREWORK# Scenario You have been given a task to create a demand forecast for the second year of sales of a premium outdoor
IFCPREWORK#
Scenario
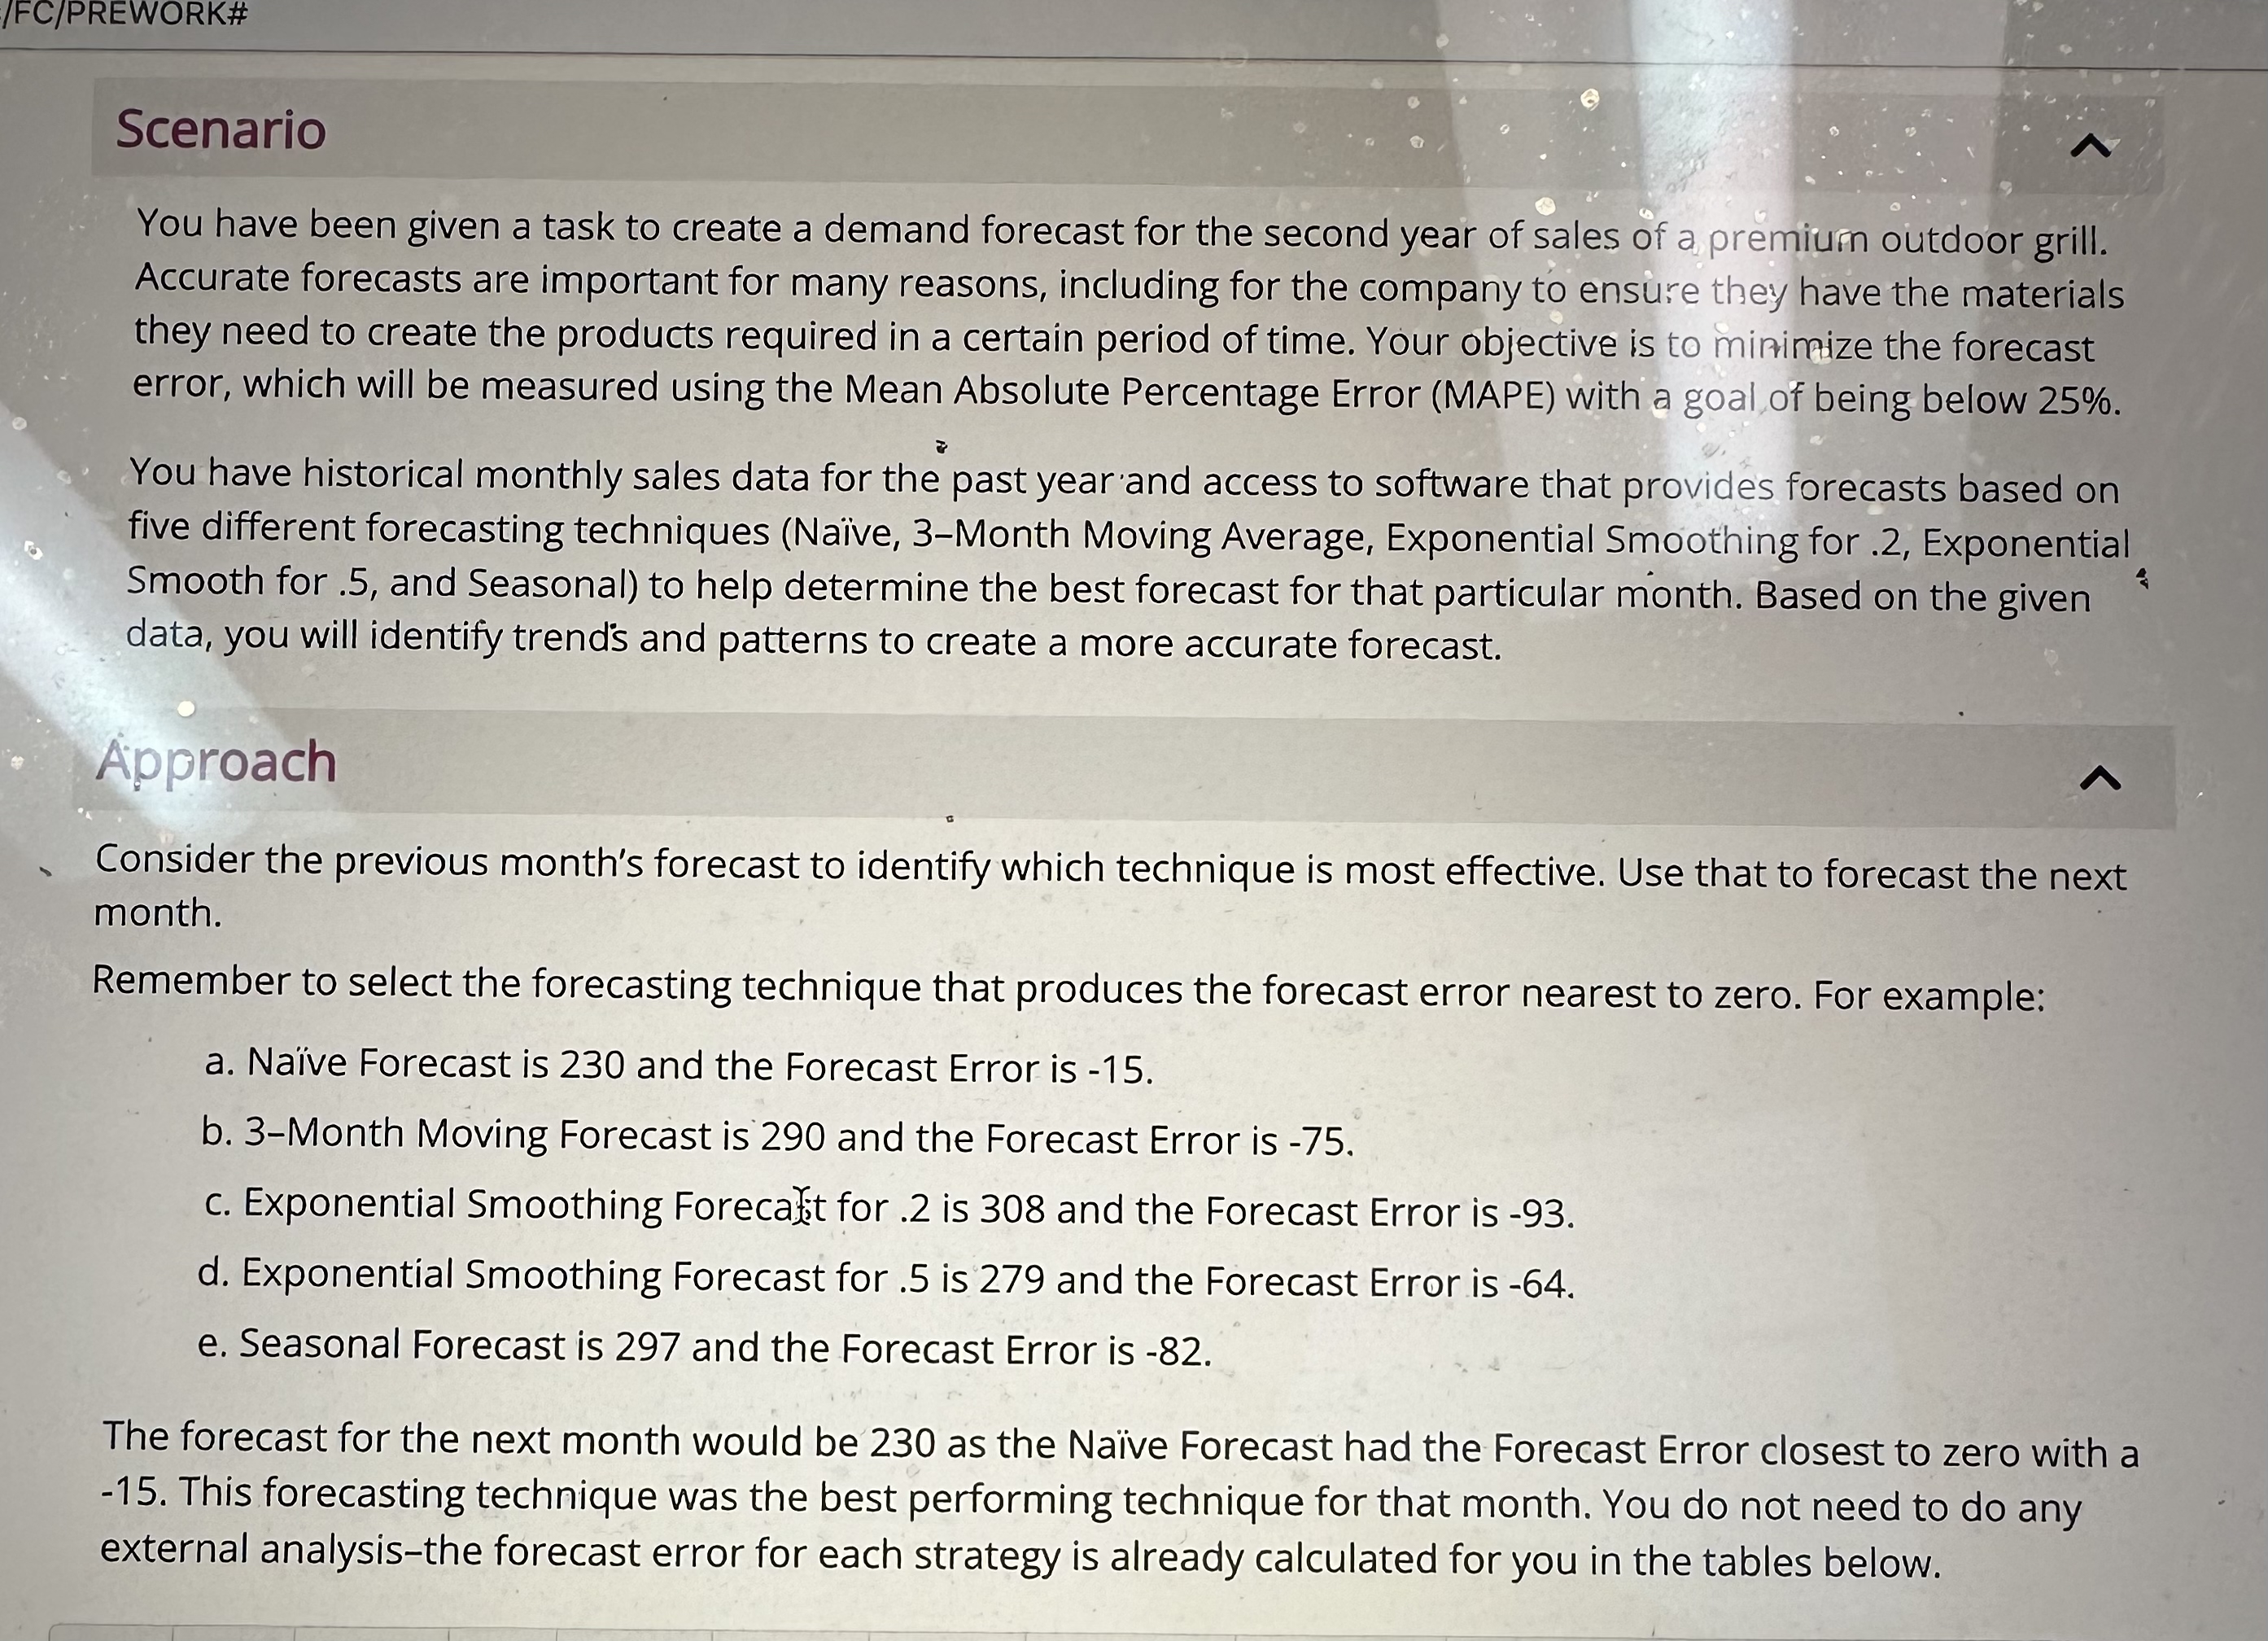
You have been given a task to create a demand forecast for the second year of sales of a premium outdoor grill. Accurate forecasts are important for many reasons, including for the company to ensure they have the materials they need to create the products required in a certain period of time. Your objective is to minimize the forecast error, which will be measured using the Mean Absolute Percentage Error MAPE with a goal of being below
You have historical monthly sales data for the past year and access to software that provides forecasts based on five different forecasting techniques NaveMonth Moving Average, Exponential Smoothing for Exponential Smooth for and Seasonal to help determine the best forecast for that particular month. Based on the given data, you will identify trend's and patterns to create a more accurate forecast.
pproach
Consider the previous month's forecast to identify which technique is most effective. Use that to forecast the next month.
Remember to select the forecasting technique that produces the forecast error nearest to zero. For example:
a Nave Forecast is and the Forecast Error is
bMonth Moving Forecast is and the Forecast Error is
c Exponential Smoothing Forecalit for is and the Forecast Error is
d Exponential Smoothing Forecast for is and the Forecast Error is
e Seasonal Forecast is and the Forecast Error is
The forecast for the next month would be as the Nave Forecast had the Forecast Error closest to zero with a This forecasting technique was the best performing technique for that month. You do not need to do any external analysisthe forecast error for each strategy is already calculated for you in the tables below.Activity : Year Forecast
tableForecast next period,Year MAPEAverage :MAPEJANFEBMARAPRMAYJUNJULAUGSEPTOCTNOVDEC
tableActual Demand,MonthYear Year Seasonal IndexJANFEBMARAPRMAYJUNJULAUGSEPTOCTNOVDEC
Activity : Forecast Technique Analysis
Forecasting technique that best fits the data: Select
Step by Step Solution
There are 3 Steps involved in it
1 Expert Approved Answer
Step: 1 Unlock

Question Has Been Solved by an Expert!
Get step-by-step solutions from verified subject matter experts
Step: 2 Unlock
Step: 3 Unlock