

Question: IFRS Global Accounting. Please complete c, d, e, f. showing all your calculations and answers to the questions asked. Ill give thumbs up! Mitsubishi Electric
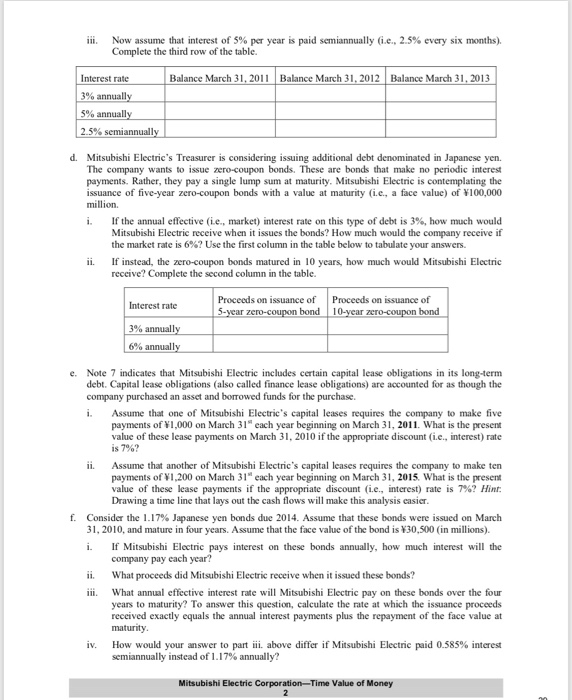
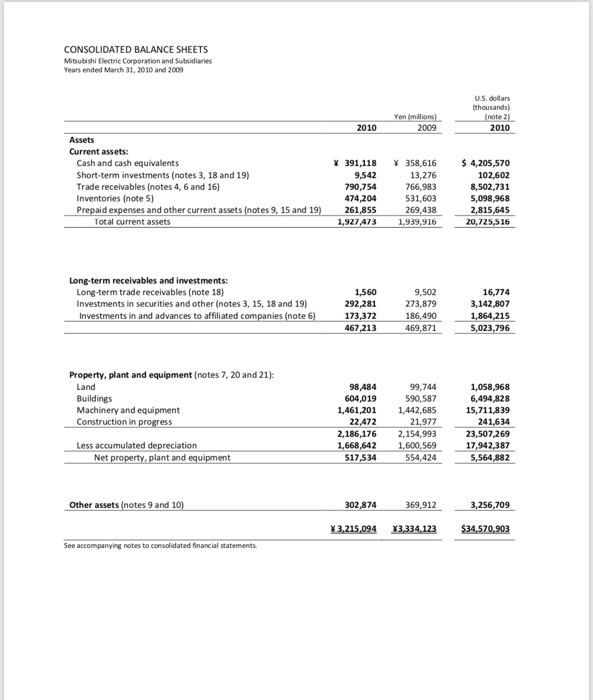
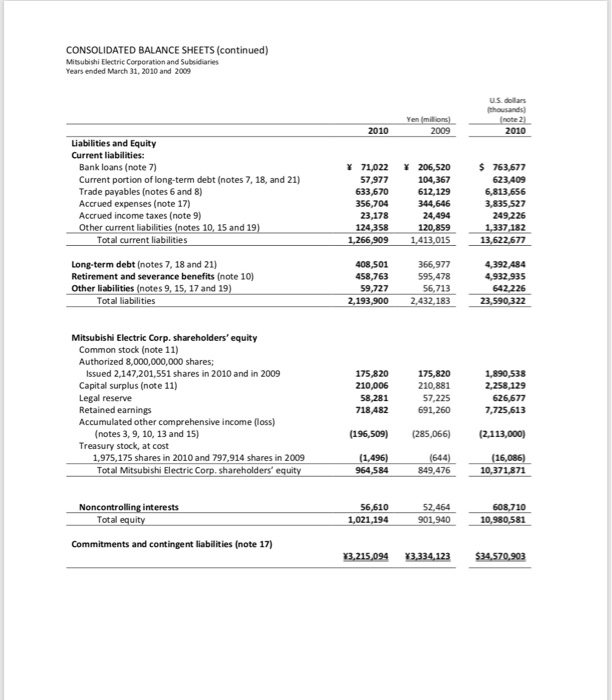
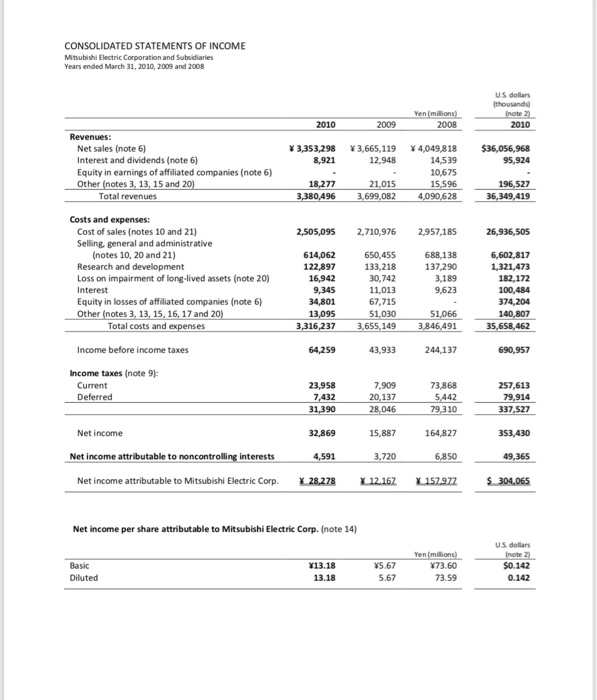
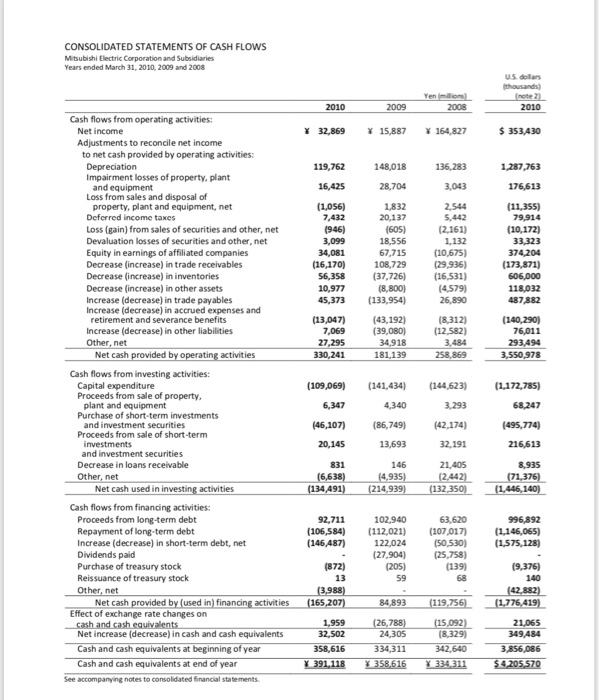
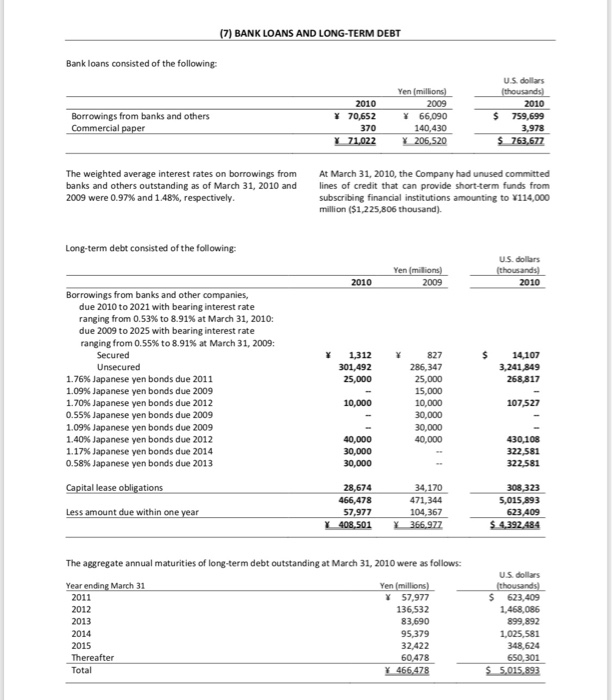
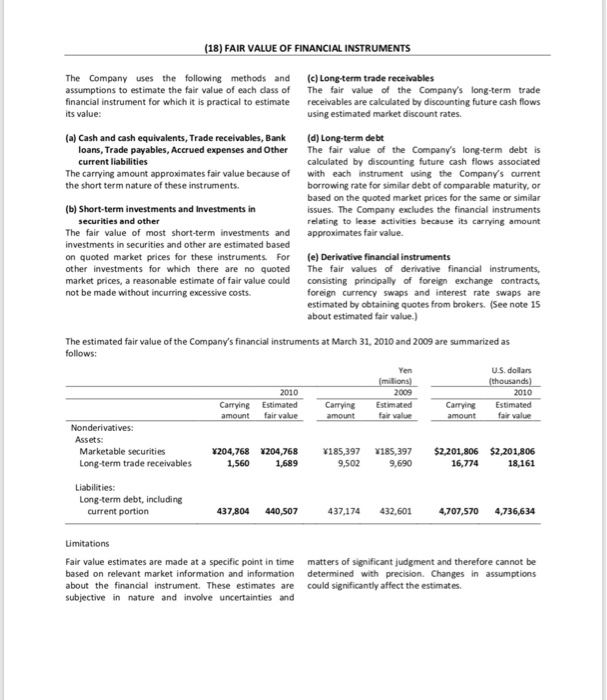
Mitsubishi Electric Corporation-Time Value of Money Mitsubishi Electric Corporation was founded in 1921 and is currently Japan's largest general trading compamy ("sogo shosha ") with over 200 bases of operations in appraximately 80 countries. Mitsubishi Electric engages in the development, mannfacture and sale of products in the Energy and Electrie Systems, Industrial Automation Systems, Information and Commumication Systems, Electronic Devices, Home Appliances and Other business fields The Company is listed on the Tokyo Stock Exchange in Japan and its American Depositary Shares are exchanged in the over-the-counter market. The Company had a total market capitalization of approximately 1.800 billion US S21.3 billion) at December I, 2010 y 2010 Annual Learning Objectives . Calculate the present value and the future value of a single payment. Calculate the present value of a stream of payments .Understand the effect of compounding on present and future values. .Determine the effective interest rate underlying a series of cash flows. Understand how higher or lower discount rates affect present values. Refer to the 2010 financial statements and Note 7-Bank Loans and Long-term Debt. Mitsubishi Electric's fiscal year ends on March 31 Concepts The following questions test your understanding of time value of money concepts. i. Would you rather receive 100 today or Y100 in exactly one year? Explain your choice. i What is a lump-sum payment? iii What is an annuity? What is an ordinary annuity (also called annuity in arrears)? What is an a. annuity due (also called annuity in advance)? iv. How does compound interest differ from simple interest? b. Refer to Note 7-Bank Loans and Long-Term Debt. Consider the 1.76% Japanese yen bonds due 2011. Assume that Mitsubishi Electric issued these bonds on March 31. 2009 i. How much did Mitsubishi Electric receive when it issued the bonds? (Ignore issuance costs and fees.) ii Where does this debt appear on Mitsubishi Electric's balance sheet? Statement of cash flows? Where does the cost of this debt appear on Mitsubishi Electric's income statement? Because market conditions appeared favorable, Mitsubishi Electric's Treasurer decided to raise funds through a debt issuance. Assume that on March 31, 2010, the company issued its 0.58% Japanese yen bonds due 2013. As the company had no immediate plans for the funds raised, the Treasurer placed the proceeds in an interest-bearing bank account. L c. Assume that the bank account pays 3% interest per year. The interest is paid annually on the anniversary date of the deposit and is left in the account. What will the balance of the bank account be on March 31, 2011? March 31, 2012? March 31, 2013? Use the first row in the table on the following page to tabulate your answers. ii Now assume that the bank account pays 5% per year. Complete the second row of the table. Mitsubishi Electric Corporation-Time Value of Money Copyright 2012 by Cambridge Basiness Publishers LLC. Ali rights reserved No purtofokis palliationy be any purpose witho" she written prmninion of the publisher n any form Jor iii. Now assume that interest of 5% per year is paid semiannually (ie, 2.5% every six months). Complete the third row of the table. Balance March 3, 2011 Balance March 31, 2012 Balance March 31, 2013 Interest rate 3% annually 5% annual semiannuall d. Mitsubishi Electric's Treasurer is considering issuing additional debt denominated in Japanese yen The company wants to issue zero-coupon bonds. These are bonds that make no periodic interest payments. Rather, they pay a single lump sum at maturity. Mitsubishi Electric is contemplating the issuance of five-year zero-coupon bonds with a value at maturity (i.e, a face value) of Y100,000 million. i. If the annual effective (i.e., market) interest rate on this type of debt is 3%, how much would Mitsubishi Electric receive when it issues the bonds? How much would the company receive if the market rate is 6%? Use the first column in the table below to tabulate your answers. ii. If instead, the zero-coupon bonds matured in 10 years, how much would Mitsubishi Electric receive? Complete the second column in the table. Proceeds on issuance of Proceeds on issuance of 5- Interest rate 3% annuali 6% annuali zero-coupon bond n bond Note 7 indicates that Mitsubishi Electric includes certain capital lease obligations in its long-term debt. Capital lease obligations (also called finance lease obligations) are accounted for as though the e. company purchased an asset and borrowed funds for the purchase i. Assume that one of Mitsubishi Electric's capital leases requires the company to make five payments of 1,000 on March 3 each year beginning on March 3, 2011. What is the present value of these lease payments on March 31, 2010 if the appropriate discount (i.e., interest) rate is 7%? ii Assume that another of Mitsubishi Electric's capital leases requires the company to make ten payments of V1,200 on March 31 each year beginning on March 31, 2015. What is the present value of these lease payments if the appropriate discount (ie, interest) rate is 7%? Hin Drawing a time line that lays out the cash flows will make this analysis easier f. Consider the 1.17% Japanese yen bonds due 2014, Assume that these bonds were issued on March 31, 2010, and mature in four years. Assume that the face value of the bond is 30,500 (in millions). i. f Mitsubishi Electric pays interest on these bonds annually, how much interest will the company pay each year ii What proceeds did Mitsubishi Electric receive when it issued these bonds? iii. What annual effective interest rate will Mitsubishi Electric pay on these bonds over the four years to maturity? To answer this question, calculate the rate at which the issuance proceeds received exactly equals the annual interest payments plus the repayment of the face value at maturity iv. How would your answer to part iii. above differ if Mitsubishi Electric paid 0.585% interest semiannually instead of 1.17% annually? Mitsubishi Electric Value of Money Analysis g. Note 18 discloses the fair value of Mitsubishi Electric's financial instruments, including its long-tem debt. According to paragraph (d) Long-term debt, Mitsubishi Electric calculates the fair value of its long-term debt by discounting the future cash flows associated with each debt instrument at its current borrowing rate (i.e., the current market rate). In contrast, the carrying amount of debt reflected on Mitsubishi Electric's balance sheet is determined by discounting these future cash flows using the market rate at the time of the issuance of each debt instrument. i. Compare the carrying amount and estimated fair value of Mitsubishi Electric's long-term debt at March 31, 2010. Which of these two amounts is higher? What does this relation imply about the company's current market rate -is it higher or lower, on average than the market rate at issuance? ii. Now compare the carrying amount and estimated fair value of Mitsubishi Electric's long-term debt at March 31, 2009. Which of these two amounts is higher? What does this relation imply about the company's current market rate at March 31, 2009- is it higher or lower, on average than the market rate at issuance? Mitsubishi Electric Corporation-Time Value of Money CONSOLIDATED BALANCE SHEETS Misubishi Electric Corporation and Subsidiaries Years ended March 31, 2010 and 2009 U.S. dollars 2010 2009 2010 Assets Current assets: Cash and cash equivalents Short-term investments (notes 3, 18 and 19) Trade receivables (notes 4, 6 and 16) Inventories (note 5) 391,118 358,616 4,205,570 102,602 8,502,731 $,098,968 2,815,645 1,9274731,939.91620,725,516 9,542 790,754 474,204 261,855 13,276 766,983 531,603 269,438 and other current assets (notes 9, 15 and 19 Total current assets Long-term receivables and investments: Long-term trade receivables (note 18) Investments in securities and other (notes 3, 15, 18 and 19) Investments in and advances to affiliated d 1,560 292,281 173,372 67,213 9,502 273,879 186,490 469 16,774 3,142,807 1,864 215 796 Property, plant and equipment (notes 7, 20 and 21) Land 99,744 590,587 1,461,201 1,442,685 21,977 2,186,176 2,154,993 98,484 604,019 22,472 1,668,642 1,058,968 6,494,828 15,711,839 41,634 23,507,269 17,942,387 5,564 882 Machinery and equipment Construction in Less accumulated depreciation Net t and 17,534 54,424 Other assets ( 9 and 1 302,874 369,912 709 3,215,094 13334,123 $34,570,903 CONSOLIDATED BALANCE SHEETS (continued) Mitsubishi Electric Corporation and Subsidiaries Years ended March 31, 2010 and 2009 U.S. dolars 2010 2010 Liabilities and Equity Current liabilities: $ 763,677 623,409 Bank loans (note 7) Current portion of long-term debt (notes 7, 18, and 21) Trade payables (notes 6 and 8) Accrued expenses (note 17) Accrued income taxes (note 9 Other current liabilities (notes 10, 15 and 19 57,977 633,670 356,704 23,178 124.358 71,022 206,520 104,367 612,129 344,646 24,494 3,835,527 249,226 120,8591337,182 Total current liabilities 3,015 13,622,677 Long-term debt (notes 7, 18 and 21) Retirement and severance benefits (note 10) Other liabilities (notes 9,15,17 and 19) 408,501 458,763 9,727 3,900 366,977 595,478 56,713 4,392 ,484 4,932,935 642 226 Total liabilities Mitsubishi Electric Corp. shareholders' equity Common stock (note 11) Authorized 8,000,000,000 shares Issued 2,147,201,551 shares in 2010 and in 2009 Capital surplus (note 11) Legal reserve Retained earnings Accumulated other comprehensive income (loss) 175,820 210,006 58,281 718,482 175,820 210,881 57,225 691,260 2,258,129 626,677 7,725,613 (notes 3, 9, 10, 13 and 15) (196,509) (285,066) (2,113,000) Treasury stock, at cost 1,975,175 shares in 2010 and 797,914 shares in 2009 Total Mitsubishi Electric 849,476 10,371871 6,610 52,464 901,940 Noncontrolling interests 608,710 Total Commitments and contingent liabilities (note 17) CONSOLIDATED STATEMENTS OF INCOME Mtsubishi Electric Corporation and Subsidiaries Years ended March 31, 2010, 2009 and 2008 U.S dollars 2010 2008 note 2 2009 2010 Net sales (note 6) Interest and dividends (note 6) Equity in earnings of affiliated companies (note 6) Other (notes 3, 13, 15 and 20)18,277 3,353,298 3,665,119 4,049,818 36,056,968 8,921 12,948 4,539 10,675 15,596 21,015 196,527 Total revenues Costs and expenses: Cost of sales (notes 10 and 21) Selling, general and administrative 2,505,095 2,710,976 2,957,185 (notes 10, 20 and 21) Research and development Loss on impairment of long-lived assets (note 20) 614,062 122,897 16,942 650,455 133,218 30,742 11,013 67,715 1,030 655,149 688,138 137,290 3,189 9,623 6,602,817 1,321,473 182,172 Equity in losses of affiliated companies (note 6) Other (notes 3,13, 15,16,17 and 34,801 13,095 -- 140,807 Total costs and Income before income taxes 64,259 43,933 244,137 690,957 Income taxes (note 9): 7,909 137 23,958 73,868 257,613 79,914 Deferred Net income 15,887 Net income attributable to noncontrolling interests 720 6,850 49,365 Net income attributable to Mitsubishi Electric Corp. 28,278 12.16 157.97 304,065 Net income per share attributable to Mitsubishi Electric Corp. (note 14 U.S dollars $0.142 0.142 Basic 13.18 13.18 5.67 5.67 73.60 73.59 CONSOLIDATED STATEMENTS OF CASH FLOws Mitsublshi Electric Corporation and Subsidiaries Years ended March 31, 2010, 2009 and 2008 U.5 dollars 2010 2008 2010 Cash flows from operating activities: Net income 32,869 15,887164,827 $353,430 Adjustments to reconcile net income to net cash provided by operating activities: Depreciation Impairment losses of property, plant 1,287,763 176,613 (11,355) 119,762 148,018 136,283 28,704 and equipment Loss from sales and disposal of property, plant and equipment, net Deferred income taxes Loss (gain) from sales of securities and other, net Devaluation losses of securities and other, net Equity in earnings of affiliated companies Decrease (increase) in trade receivables Decrease (increase) in inventories Decrease (increase) in other assets Increase (decrease) in trade payables Increase (decrease) in accrued expenses and (1,056) 7,432 1,832 20,137 18,556 67,715 108,729 (37,726) (8,800) 45,373 (133,954) (2,161) 1,132 (10,675) (29,936) (16,531) 33,323 (16,170) (173,871) 10,977 118,032 487 882 retirement and severance benefits Increase (decrease) in other liabilities (13,047) (8,312) (39,080)(12,582) 3,484 258,869 (43,192) Other, net Net cash 76011 293,494 3,550,978 4,918 27,295 330,241 g activities Cash flows from investing activities: 1,172,785) 68,247 495,774) Capital expenditure Proceeds from sale of property (109,069) (141,434) (144,623) plant and equipment 3,293 Purchase of short-term investments 46,107(86,749) and investment securities Proceeds from sale of short-term 32,191 and investment securities Decrease in loans receivable Other, net 831 Net cash used in Cash flows from financing activities: Proceeds from long-term debt Repayment of long-term debt Increase (decrease) in short-term debt, net Dividends paid Purchase of treasury stock Reissuance of treasury stock Other, net 92,711 (106,584) (112,021 (107,017 (27,904) (25,758) 68 4S0,53) 575,128) 140 Netcashprovided bylused infinancingactivities- (165 207). 84893-1119756/ -(1 776 419. Effect of exchange rate changes on ,092) (8,329) 21,065 349484 Net increase (decrease) in cash and cash equivalents ash and cash equivalents at beginning of year Cash and cash equivalents at end of year 391.118 358616311 BANK LOANS AND LONG-TERM DEBT Bank loans consisted of the following U.5 dollars 2009 66,090 140,430 71,022 206,520 2010 70,652 2010 $759,699 3,978 Borrowings from banks and others The weighted average interest rates on borrowings from banks and others outstanding as of March 31, 2010 and 2009 were 0.97% and 1.48%, respectively At March 31, 2010, the Company had unused committed lines of credit that can provide short-term funds from subscribing financial institutions amounting to 114,000 million ($1 ,2 25,806 thousand). Long-term debt consisted of the following U.S. dollars 2010 2010 Borrowings from banks and other companies, due 2010 to 2021 with bearing interest rate ranging from 0.53% to 8.91% at March 31, 2010: due 2009 to 2025 with bearing interest rate ranging from 0.55% to 8.91% at March 31, 2009: 1312 301,492 25,000 $14,107 268,817 107,527 827 286,347 1.76% Japanese yen bonds due 2011 1.09% Japanese yen bonds due 2009 1.70% Japanese yen bonds due 2012 0.55% Japanese yen bonds due 2009 1.09% Japanese yen bonds due 2009 1.40% Japanese yen bonds due 2012 1.17% Japanese yen bonds due 2014 0.58% Japanese yen bonds due 2013 30,000 40,000 30,000 430,108 308,323 5,015 893 170 471,344 367 408,501 366,.972 28,674 Less amount due within one year 57,977 The aggregate annual maturities of long-term debt outstanding at March 31, 2010 were as follows U.5. dollars March 31 2011 57,977 $ 623,409 1,468,086 2013 2014 2015 32,422 60,478 348,624 650,301 Total FAIR VALUE OF FINANCIAL INSTRUMENTS The Company uses the following methods and assumptions to estimate the fair value of each dass of financial instrument for which it is practical to estimate its value: (c) Long-term trade receivables The fair value of the Company's long-term trade receivables are calculated by discounting future cash flows using estimated market discount rates. (a) Cash and cash equivalents, Trade receivables, Bank (d) Long-term debt The fair value of the Company's long-term debt is calculated by discounting future cash flows associated with each instrument using the Company's current borrowing rate for similar debt of comparable maturity, or based on the quoted market prices for the same or similar issues. The Company excludes the financial instruments relating to lease activities because its carrying amount loans, Trade payables, Accrued expenses and Other current liabilities The carrying amount approximates fair value because of the short term nature of these instruments. (b) Short-term investments and Investments in securities and other The fair value of most short-term investments and approximates fair value investments in securities and other are estimated based on quoted market prices for these instruments For e) Derivative financial instruments other investments for which there are no quoted The fair values of derivative financial instruments, market prices, a reasonable estimate of fair value could consisting principally of foreign exchange contracts not be made without incurring excessive costs foreign currency swaps and interest rate swaps are estimated by obtaining quotes from brokers. (See note 15 about estimated fair value.) The estimated fair value of the Company's financial instruments at March 31, 2010 and 2009 are summarized as follows: Yen U.S. dolars Carrying Estimated amount fair value Estimated fair value Carrying Estimated amountfair value Nonderivatives: Assets: Marketable securities Long-term trade receivables 1204,768 1204,768 185,397 185,397 $2201,806 $2,201806 18,161 1,560 1,689 9,690 16,774 Liabilities: Long-term debt, including current portion 437,804 440 s07 4 37,174 432,601 4,707,570 4,736,634 Limitations Fair value estimates are made at a specific point in time matters of significant judgment and therefore cannot be based on relevant market information and information determined with precision. Changes in assumptions about the financial instrument. These estimates are could significantly affect the estimates subjective in nature and involve uncertainties and Mitsubishi Electric Corporation-Time Value of Money Mitsubishi Electric Corporation was founded in 1921 and is currently Japan's largest general trading compamy ("sogo shosha ") with over 200 bases of operations in appraximately 80 countries. Mitsubishi Electric engages in the development, mannfacture and sale of products in the Energy and Electrie Systems, Industrial Automation Systems, Information and Commumication Systems, Electronic Devices, Home Appliances and Other business fields The Company is listed on the Tokyo Stock Exchange in Japan and its American Depositary Shares are exchanged in the over-the-counter market. The Company had a total market capitalization of approximately 1.800 billion US S21.3 billion) at December I, 2010 y 2010 Annual Learning Objectives . Calculate the present value and the future value of a single payment. Calculate the present value of a stream of payments .Understand the effect of compounding on present and future values. .Determine the effective interest rate underlying a series of cash flows. Understand how higher or lower discount rates affect present values. Refer to the 2010 financial statements and Note 7-Bank Loans and Long-term Debt. Mitsubishi Electric's fiscal year ends on March 31 Concepts The following questions test your understanding of time value of money concepts. i. Would you rather receive 100 today or Y100 in exactly one year? Explain your choice. i What is a lump-sum payment? iii What is an annuity? What is an ordinary annuity (also called annuity in arrears)? What is an a. annuity due (also called annuity in advance)? iv. How does compound interest differ from simple interest? b. Refer to Note 7-Bank Loans and Long-Term Debt. Consider the 1.76% Japanese yen bonds due 2011. Assume that Mitsubishi Electric issued these bonds on March 31. 2009 i. How much did Mitsubishi Electric receive when it issued the bonds? (Ignore issuance costs and fees.) ii Where does this debt appear on Mitsubishi Electric's balance sheet? Statement of cash flows? Where does the cost of this debt appear on Mitsubishi Electric's income statement? Because market conditions appeared favorable, Mitsubishi Electric's Treasurer decided to raise funds through a debt issuance. Assume that on March 31, 2010, the company issued its 0.58% Japanese yen bonds due 2013. As the company had no immediate plans for the funds raised, the Treasurer placed the proceeds in an interest-bearing bank account. L c. Assume that the bank account pays 3% interest per year. The interest is paid annually on the anniversary date of the deposit and is left in the account. What will the balance of the bank account be on March 31, 2011? March 31, 2012? March 31, 2013? Use the first row in the table on the following page to tabulate your answers. ii Now assume that the bank account pays 5% per year. Complete the second row of the table. Mitsubishi Electric Corporation-Time Value of Money Copyright 2012 by Cambridge Basiness Publishers LLC. Ali rights reserved No purtofokis palliationy be any purpose witho" she written prmninion of the publisher n any form Jor iii. Now assume that interest of 5% per year is paid semiannually (ie, 2.5% every six months). Complete the third row of the table. Balance March 3, 2011 Balance March 31, 2012 Balance March 31, 2013 Interest rate 3% annually 5% annual semiannuall d. Mitsubishi Electric's Treasurer is considering issuing additional debt denominated in Japanese yen The company wants to issue zero-coupon bonds. These are bonds that make no periodic interest payments. Rather, they pay a single lump sum at maturity. Mitsubishi Electric is contemplating the issuance of five-year zero-coupon bonds with a value at maturity (i.e, a face value) of Y100,000 million. i. If the annual effective (i.e., market) interest rate on this type of debt is 3%, how much would Mitsubishi Electric receive when it issues the bonds? How much would the company receive if the market rate is 6%? Use the first column in the table below to tabulate your answers. ii. If instead, the zero-coupon bonds matured in 10 years, how much would Mitsubishi Electric receive? Complete the second column in the table. Proceeds on issuance of Proceeds on issuance of 5- Interest rate 3% annuali 6% annuali zero-coupon bond n bond Note 7 indicates that Mitsubishi Electric includes certain capital lease obligations in its long-term debt. Capital lease obligations (also called finance lease obligations) are accounted for as though the e. company purchased an asset and borrowed funds for the purchase i. Assume that one of Mitsubishi Electric's capital leases requires the company to make five payments of 1,000 on March 3 each year beginning on March 3, 2011. What is the present value of these lease payments on March 31, 2010 if the appropriate discount (i.e., interest) rate is 7%? ii Assume that another of Mitsubishi Electric's capital leases requires the company to make ten payments of V1,200 on March 31 each year beginning on March 31, 2015. What is the present value of these lease payments if the appropriate discount (ie, interest) rate is 7%? Hin Drawing a time line that lays out the cash flows will make this analysis easier f. Consider the 1.17% Japanese yen bonds due 2014, Assume that these bonds were issued on March 31, 2010, and mature in four years. Assume that the face value of the bond is 30,500 (in millions). i. f Mitsubishi Electric pays interest on these bonds annually, how much interest will the company pay each year ii What proceeds did Mitsubishi Electric receive when it issued these bonds? iii. What annual effective interest rate will Mitsubishi Electric pay on these bonds over the four years to maturity? To answer this question, calculate the rate at which the issuance proceeds received exactly equals the annual interest payments plus the repayment of the face value at maturity iv. How would your answer to part iii. above differ if Mitsubishi Electric paid 0.585% interest semiannually instead of 1.17% annually? Mitsubishi Electric Value of Money Analysis g. Note 18 discloses the fair value of Mitsubishi Electric's financial instruments, including its long-tem debt. According to paragraph (d) Long-term debt, Mitsubishi Electric calculates the fair value of its long-term debt by discounting the future cash flows associated with each debt instrument at its current borrowing rate (i.e., the current market rate). In contrast, the carrying amount of debt reflected on Mitsubishi Electric's balance sheet is determined by discounting these future cash flows using the market rate at the time of the issuance of each debt instrument. i. Compare the carrying amount and estimated fair value of Mitsubishi Electric's long-term debt at March 31, 2010. Which of these two amounts is higher? What does this relation imply about the company's current market rate -is it higher or lower, on average than the market rate at issuance? ii. Now compare the carrying amount and estimated fair value of Mitsubishi Electric's long-term debt at March 31, 2009. Which of these two amounts is higher? What does this relation imply about the company's current market rate at March 31, 2009- is it higher or lower, on average than the market rate at issuance? Mitsubishi Electric Corporation-Time Value of Money CONSOLIDATED BALANCE SHEETS Misubishi Electric Corporation and Subsidiaries Years ended March 31, 2010 and 2009 U.S. dollars 2010 2009 2010 Assets Current assets: Cash and cash equivalents Short-term investments (notes 3, 18 and 19) Trade receivables (notes 4, 6 and 16) Inventories (note 5) 391,118 358,616 4,205,570 102,602 8,502,731 $,098,968 2,815,645 1,9274731,939.91620,725,516 9,542 790,754 474,204 261,855 13,276 766,983 531,603 269,438 and other current assets (notes 9, 15 and 19 Total current assets Long-term receivables and investments: Long-term trade receivables (note 18) Investments in securities and other (notes 3, 15, 18 and 19) Investments in and advances to affiliated d 1,560 292,281 173,372 67,213 9,502 273,879 186,490 469 16,774 3,142,807 1,864 215 796 Property, plant and equipment (notes 7, 20 and 21) Land 99,744 590,587 1,461,201 1,442,685 21,977 2,186,176 2,154,993 98,484 604,019 22,472 1,668,642 1,058,968 6,494,828 15,711,839 41,634 23,507,269 17,942,387 5,564 882 Machinery and equipment Construction in Less accumulated depreciation Net t and 17,534 54,424 Other assets ( 9 and 1 302,874 369,912 709 3,215,094 13334,123 $34,570,903 CONSOLIDATED BALANCE SHEETS (continued) Mitsubishi Electric Corporation and Subsidiaries Years ended March 31, 2010 and 2009 U.S. dolars 2010 2010 Liabilities and Equity Current liabilities: $ 763,677 623,409 Bank loans (note 7) Current portion of long-term debt (notes 7, 18, and 21) Trade payables (notes 6 and 8) Accrued expenses (note 17) Accrued income taxes (note 9 Other current liabilities (notes 10, 15 and 19 57,977 633,670 356,704 23,178 124.358 71,022 206,520 104,367 612,129 344,646 24,494 3,835,527 249,226 120,8591337,182 Total current liabilities 3,015 13,622,677 Long-term debt (notes 7, 18 and 21) Retirement and severance benefits (note 10) Other liabilities (notes 9,15,17 and 19) 408,501 458,763 9,727 3,900 366,977 595,478 56,713 4,392 ,484 4,932,935 642 226 Total liabilities Mitsubishi Electric Corp. shareholders' equity Common stock (note 11) Authorized 8,000,000,000 shares Issued 2,147,201,551 shares in 2010 and in 2009 Capital surplus (note 11) Legal reserve Retained earnings Accumulated other comprehensive income (loss) 175,820 210,006 58,281 718,482 175,820 210,881 57,225 691,260 2,258,129 626,677 7,725,613 (notes 3, 9, 10, 13 and 15) (196,509) (285,066) (2,113,000) Treasury stock, at cost 1,975,175 shares in 2010 and 797,914 shares in 2009 Total Mitsubishi Electric 849,476 10,371871 6,610 52,464 901,940 Noncontrolling interests 608,710 Total Commitments and contingent liabilities (note 17) CONSOLIDATED STATEMENTS OF INCOME Mtsubishi Electric Corporation and Subsidiaries Years ended March 31, 2010, 2009 and 2008 U.S dollars 2010 2008 note 2 2009 2010 Net sales (note 6) Interest and dividends (note 6) Equity in earnings of affiliated companies (note 6) Other (notes 3, 13, 15 and 20)18,277 3,353,298 3,665,119 4,049,818 36,056,968 8,921 12,948 4,539 10,675 15,596 21,015 196,527 Total revenues Costs and expenses: Cost of sales (notes 10 and 21) Selling, general and administrative 2,505,095 2,710,976 2,957,185 (notes 10, 20 and 21) Research and development Loss on impairment of long-lived assets (note 20) 614,062 122,897 16,942 650,455 133,218 30,742 11,013 67,715 1,030 655,149 688,138 137,290 3,189 9,623 6,602,817 1,321,473 182,172 Equity in losses of affiliated companies (note 6) Other (notes 3,13, 15,16,17 and 34,801 13,095 -- 140,807 Total costs and Income before income taxes 64,259 43,933 244,137 690,957 Income taxes (note 9): 7,909 137 23,958 73,868 257,613 79,914 Deferred Net income 15,887 Net income attributable to noncontrolling interests 720 6,850 49,365 Net income attributable to Mitsubishi Electric Corp. 28,278 12.16 157.97 304,065 Net income per share attributable to Mitsubishi Electric Corp. (note 14 U.S dollars $0.142 0.142 Basic 13.18 13.18 5.67 5.67 73.60 73.59 CONSOLIDATED STATEMENTS OF CASH FLOws Mitsublshi Electric Corporation and Subsidiaries Years ended March 31, 2010, 2009 and 2008 U.5 dollars 2010 2008 2010 Cash flows from operating activities: Net income 32,869 15,887164,827 $353,430 Adjustments to reconcile net income to net cash provided by operating activities: Depreciation Impairment losses of property, plant 1,287,763 176,613 (11,355) 119,762 148,018 136,283 28,704 and equipment Loss from sales and disposal of property, plant and equipment, net Deferred income taxes Loss (gain) from sales of securities and other, net Devaluation losses of securities and other, net Equity in earnings of affiliated companies Decrease (increase) in trade receivables Decrease (increase) in inventories Decrease (increase) in other assets Increase (decrease) in trade payables Increase (decrease) in accrued expenses and (1,056) 7,432 1,832 20,137 18,556 67,715 108,729 (37,726) (8,800) 45,373 (133,954) (2,161) 1,132 (10,675) (29,936) (16,531) 33,323 (16,170) (173,871) 10,977 118,032 487 882 retirement and severance benefits Increase (decrease) in other liabilities (13,047) (8,312) (39,080)(12,582) 3,484 258,869 (43,192) Other, net Net cash 76011 293,494 3,550,978 4,918 27,295 330,241 g activities Cash flows from investing activities: 1,172,785) 68,247 495,774) Capital expenditure Proceeds from sale of property (109,069) (141,434) (144,623) plant and equipment 3,293 Purchase of short-term investments 46,107(86,749) and investment securities Proceeds from sale of short-term 32,191 and investment securities Decrease in loans receivable Other, net 831 Net cash used in Cash flows from financing activities: Proceeds from long-term debt Repayment of long-term debt Increase (decrease) in short-term debt, net Dividends paid Purchase of treasury stock Reissuance of treasury stock Other, net 92,711 (106,584) (112,021 (107,017 (27,904) (25,758) 68 4S0,53) 575,128) 140 Netcashprovided bylused infinancingactivities- (165 207). 84893-1119756/ -(1 776 419. Effect of exchange rate changes on ,092) (8,329) 21,065 349484 Net increase (decrease) in cash and cash equivalents ash and cash equivalents at beginning of year Cash and cash equivalents at end of year 391.118 358616311 BANK LOANS AND LONG-TERM DEBT Bank loans consisted of the following U.5 dollars 2009 66,090 140,430 71,022 206,520 2010 70,652 2010 $759,699 3,978 Borrowings from banks and others The weighted average interest rates on borrowings from banks and others outstanding as of March 31, 2010 and 2009 were 0.97% and 1.48%, respectively At March 31, 2010, the Company had unused committed lines of credit that can provide short-term funds from subscribing financial institutions amounting to 114,000 million ($1 ,2 25,806 thousand). Long-term debt consisted of the following U.S. dollars 2010 2010 Borrowings from banks and other companies, due 2010 to 2021 with bearing interest rate ranging from 0.53% to 8.91% at March 31, 2010: due 2009 to 2025 with bearing interest rate ranging from 0.55% to 8.91% at March 31, 2009: 1312 301,492 25,000 $14,107 268,817 107,527 827 286,347 1.76% Japanese yen bonds due 2011 1.09% Japanese yen bonds due 2009 1.70% Japanese yen bonds due 2012 0.55% Japanese yen bonds due 2009 1.09% Japanese yen bonds due 2009 1.40% Japanese yen bonds due 2012 1.17% Japanese yen bonds due 2014 0.58% Japanese yen bonds due 2013 30,000 40,000 30,000 430,108 308,323 5,015 893 170 471,344 367 408,501 366,.972 28,674 Less amount due within one year 57,977 The aggregate annual maturities of long-term debt outstanding at March 31, 2010 were as follows U.5. dollars March 31 2011 57,977 $ 623,409 1,468,086 2013 2014 2015 32,422 60,478 348,624 650,301 Total FAIR VALUE OF FINANCIAL INSTRUMENTS The Company uses the following methods and assumptions to estimate the fair value of each dass of financial instrument for which it is practical to estimate its value: (c) Long-term trade receivables The fair value of the Company's long-term trade receivables are calculated by discounting future cash flows using estimated market discount rates. (a) Cash and cash equivalents, Trade receivables, Bank (d) Long-term debt The fair value of the Company's long-term debt is calculated by discounting future cash flows associated with each instrument using the Company's current borrowing rate for similar debt of comparable maturity, or based on the quoted market prices for the same or similar issues. The Company excludes the financial instruments relating to lease activities because its carrying amount loans, Trade payables, Accrued expenses and Other current liabilities The carrying amount approximates fair value because of the short term nature of these instruments. (b) Short-term investments and Investments in securities and other The fair value of most short-term investments and approximates fair value investments in securities and other are estimated based on quoted market prices for these instruments For e) Derivative financial instruments other investments for which there are no quoted The fair values of derivative financial instruments, market prices, a reasonable estimate of fair value could consisting principally of foreign exchange contracts not be made without incurring excessive costs foreign currency swaps and interest rate swaps are estimated by obtaining quotes from brokers. (See note 15 about estimated fair value.) The estimated fair value of the Company's financial instruments at March 31, 2010 and 2009 are summarized as follows: Yen U.S. dolars Carrying Estimated amount fair value Estimated fair value Carrying Estimated amountfair value Nonderivatives: Assets: Marketable securities Long-term trade receivables 1204,768 1204,768 185,397 185,397 $2201,806 $2,201806 18,161 1,560 1,689 9,690 16,774 Liabilities: Long-term debt, including current portion 437,804 440 s07 4 37,174 432,601 4,707,570 4,736,634 Limitations Fair value estimates are made at a specific point in time matters of significant judgment and therefore cannot be based on relevant market information and information determined with precision. Changes in assumptions about the financial instrument. These estimates are could significantly affect the estimates subjective in nature and involve uncertainties and
Step by Step Solution
There are 3 Steps involved in it

Get step-by-step solutions from verified subject matter experts