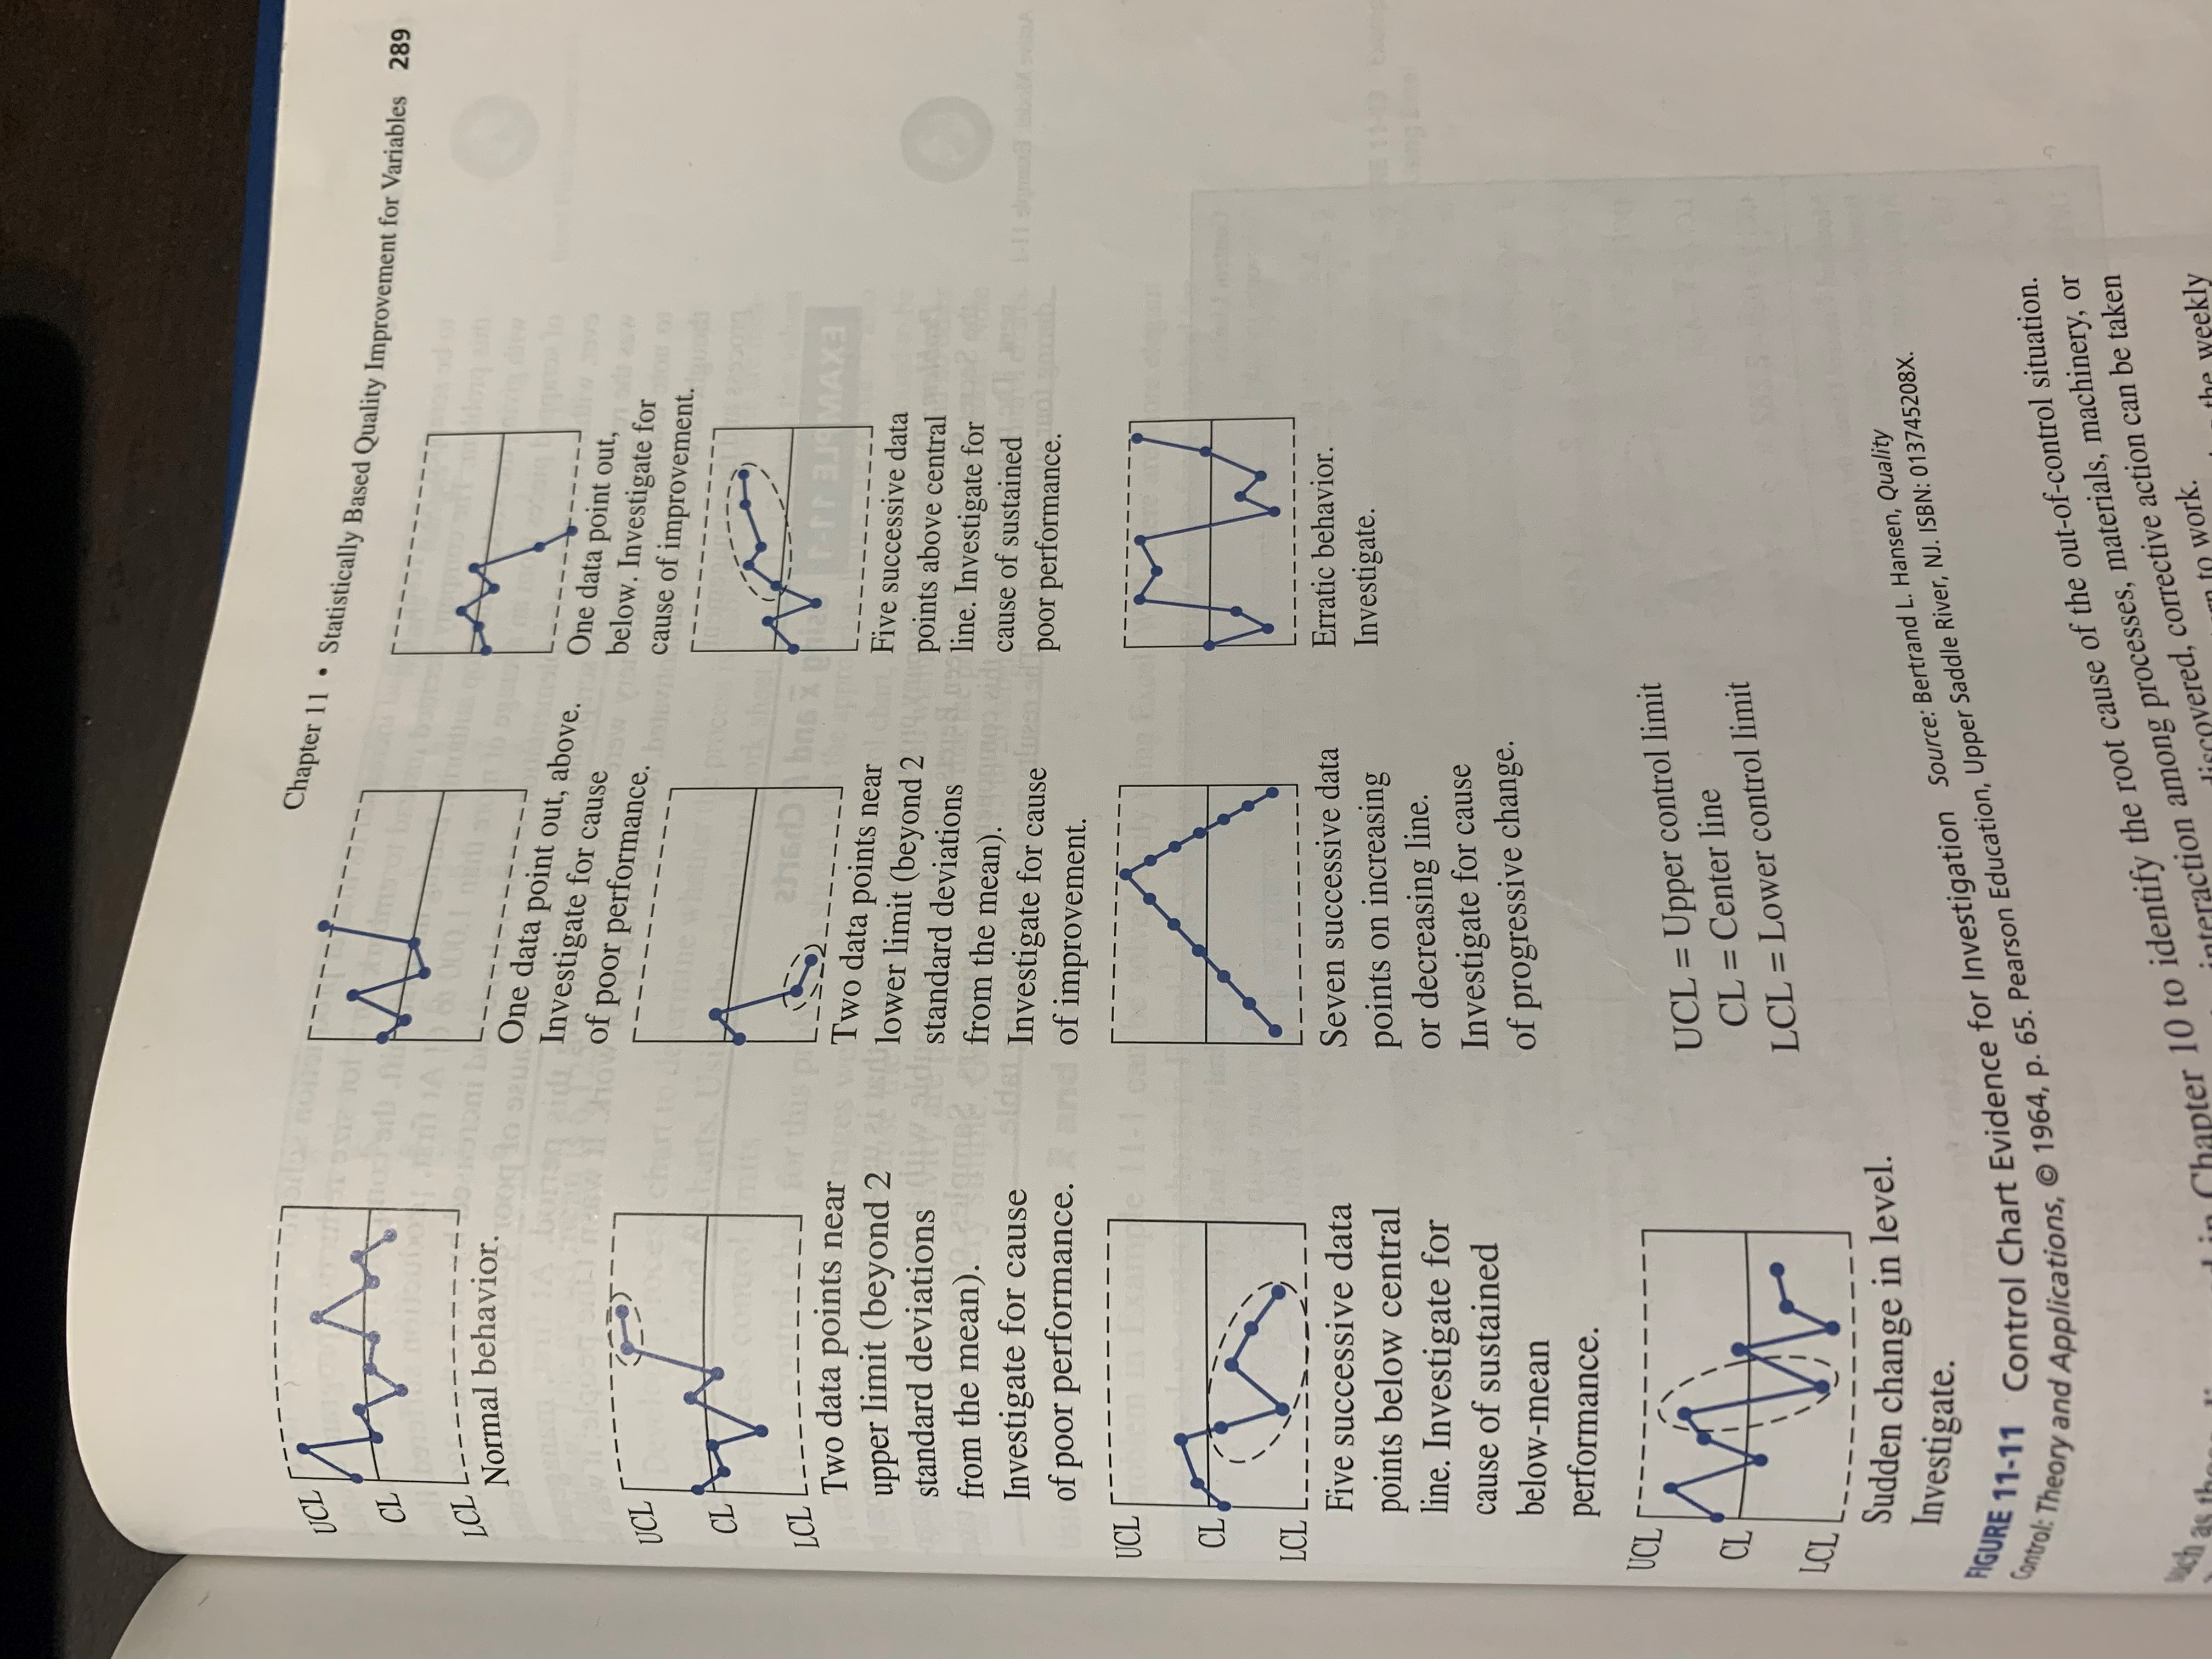
Question: ige non Chapter 11 . Statistically Based Quality Improvement for Variables 289 LCL L- Normal behavior. .loog 10 saw One data point out, above. HI

ige non Chapter 11 . Statistically Based Qualityige non Chapter 11 . Statistically Based Quality
ige non Chapter 11 . Statistically Based Quality Improvement for Variables 289 LCL L- Normal behavior. .loog 10 saw One data point out, above. HI SHOV Investigate for cause One data point out, of poor performance. below. Investigate for cause of improvement. CL Two data points near AXA upper limit (beyond 2 Two data points near lower limit (beyond 2 Five successive data standard deviations standard deviations points above central from the mean). from the mean). line. Investigate for Investigate for cause Investigate for cause cause of sustained of poor performance. poor performance. of improvement. UCL LCL Erratic behavior. Five successive data Seven successive data points on increasing Investigate. points below central line. Investigate for or decreasing line. cause of sustained Investigate for cause below-mean of progressive change. performance. UCL = Upper control limit CL = Center line LCL = Lower control limit Sudden change in level. Investigate . "GURE 11-11 Control Chart Evidence for Investigation Source: Bertrand L. Hansen, Quality Control: Theory and Applications, 1964, p. 65. Pearson Education, Upper Saddle River, NJ. ISBN: 01374520Ry ter 10 to identify the root cause of the out-of-control situation. ction among processes, materials, machinery, or overed, corrective action can be takenA B C D E F 5. Interpret the charts to determine if the processes are stable Refer to Figure 11-11 (page 289) and the lecture materials ( oscillation is only covered in the lecture materials) Stable or not stable? If not stable, explain what led you to this conclusion a Not Stable Points 1-5 b Not Stable Points 5 & 6 10 11 C Not Stable All points 1-8 12 13 d Not Stable Points 1-7, and points 4-8 14 15 e Not Stable Points 3,4,6 & 8 16 f Stable but control limits should be reevaluated becuae all poins are close to the mean 18 6. Interpret the charts to determine if the processes are stable 22 Refer to Figure 11-11 (page 289) and the lecture materials ( oscillation is only covered in the lecture materials) 23 Stable or not stable? If not stable, explain what led you to this conclusion a Stable 7 28 b Not stable Points 2 & 3, and all but three points above the mean 30 C Not stable Points 1-5 above mean and points 6-10 below mena 32 d Not Stable points 1-7 33 34 e Not Stable points 1 & 2 and points 7 & 8 36 f Not stable Many points close to control limits 37 Discussion Question 3 Discussion Question 6 | Problem 1 Problems 5 & 6 (+

Step by Step Solution

There are 3 Steps involved in it

1 Expert Approved Answer
Step: 1 Unlock blur-text-image
Question Has Been Solved by an Expert!

Get step-by-step solutions from verified subject matter experts

Step: 2 Unlock
Step: 3 Unlock

Students Have Also Explored These Related Mathematics Questions!