

Question: **Ignore values in the cell boxes** Please show calculation and explanation Check my work 11 From the data below for the Dow Jones Industrial Average,
**Ignore values in the cell boxes** Please show calculation and explanation
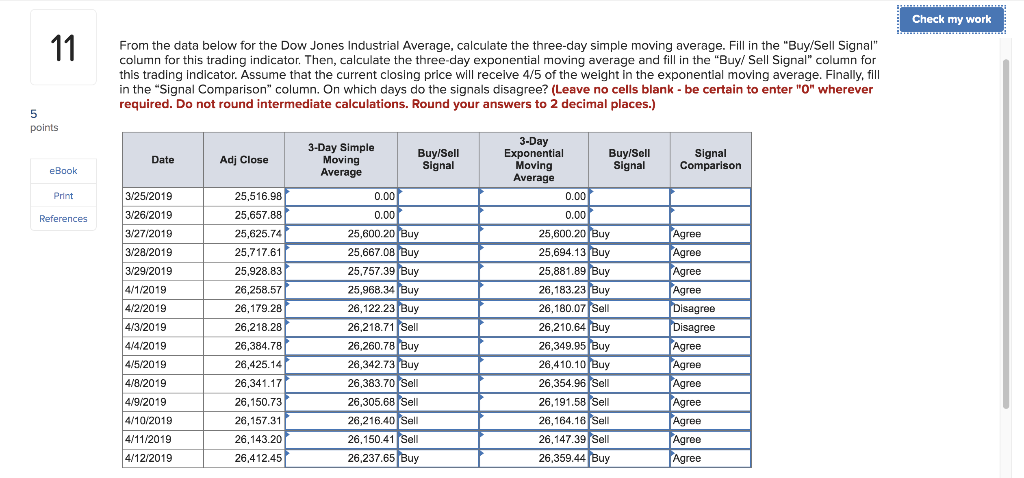
Check my work 11 From the data below for the Dow Jones Industrial Average, calculate the three-day simple moving average. Fill in the "Buy/Sell Signal" column for this trading indicator. Then, calculate the three-day exponential moving average and fill in the "Buy/ Sell Signal" column for this trading indicator. Assume that the current closing price will receive 4/5 of the weight in the exponential moving average. Finally, fill in the "Signal Comparison" column. On which days do the signals disagree? (Leave no cells blank - be certain to enter "O" wherever required. Do not round intermediate calculations. Round your answers to 2 decimal places.) 5 points Date Adj Close 3-Day Simple Moving Average Buy/Sell Signal Signal Comparison eBook Print 3/25/2019 References 3/26/2019 3/27/2019 3/28/2019 3/29/2019 25,516.98 25,657.88 25,625.74 25,717.61 25,928.83 26,258.57 26,179.28 Agree Agree Agree Agree Disagree 4/1/2019 3-Day Exponential Buy/Sell Moving Signal Average 0.00 0.00 25,600.20 Buy 25,694.13 Buy 25,881.89 Buy 26,183.23 Buy 26,180.07 Sell 26,210.64 Buy 26,349.95 Buy 26,410.10 Buy 26,354.96 Sell 26,191.58 Sell 26,164.18 Sell 26,147.39 Sell 26,359.44 Buy 4/2/2019 4/3/2019 4/4/2019 0.00 0.00 25,600.20 Buy 25,667.08 Buy 25,757.39 Buy 25,968.34 Buy 26,122.23 Buy 26,218.71 Sell 26,260.78 (Buy 26,342.73 Buy 26,383.70 Sell 26,305.68 Sell 26,216.40 Sell 26,150.41 Sell 26,237.65 Buy 26,218.28 Disagree 4/5/2019 4/8/2019 4/9/2019 26,384.78 26,425.14 26,341.17 26,150.73 26,157.31 26,143.20 26,412.45 Agree Agree Agree Agree Agree Agree Agree 4/10/2019 4/11/2019 4/12/2019
Step by Step Solution
There are 3 Steps involved in it

Get step-by-step solutions from verified subject matter experts