

Question: II - A: On a selected road section, the following accident data has been reported: table [ [ Year , Number of Accidents,Year,Number of
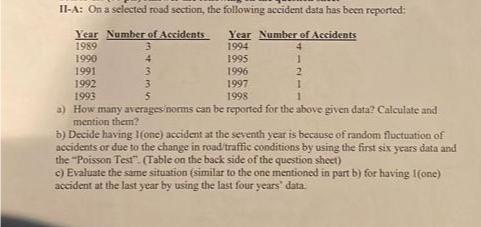
IIA: On a selected road section, the following accident data has been reported:
tableYearNumber of Accidents,Year,Number of AccidentsII
a How many averagesinoms can be reported for the above given data? Calculate and mention them?
b Decide having I one accident at the seventh yeir is because of random fluctuation of accidents or due to the change in road traffic conditions by using the first six years data and the "Poisson Test". Table on the back side of the question sheet
c Evaluate the same situation similar to the one mentioned in part b for having Ione aceident at the last year by using the last four years' data.
Step by Step Solution
There are 3 Steps involved in it
1 Expert Approved Answer
Step: 1 Unlock

Question Has Been Solved by an Expert!
Get step-by-step solutions from verified subject matter experts
Step: 2 Unlock
Step: 3 Unlock