

Question: ii . ) Make a graph of z vs . x for this data. ( Read how to use Excel, step 1 on page 3
ii
Make a graph of vs for this data. Read how to use Excel, step on page to learn about how to highlight nonadjacent columns in the graphing guidelines.
Exercise II: Linear Least Squares Fit Error Analysis
First, read Section II of the "Error Analysis" section in the beginning of your lab manual.
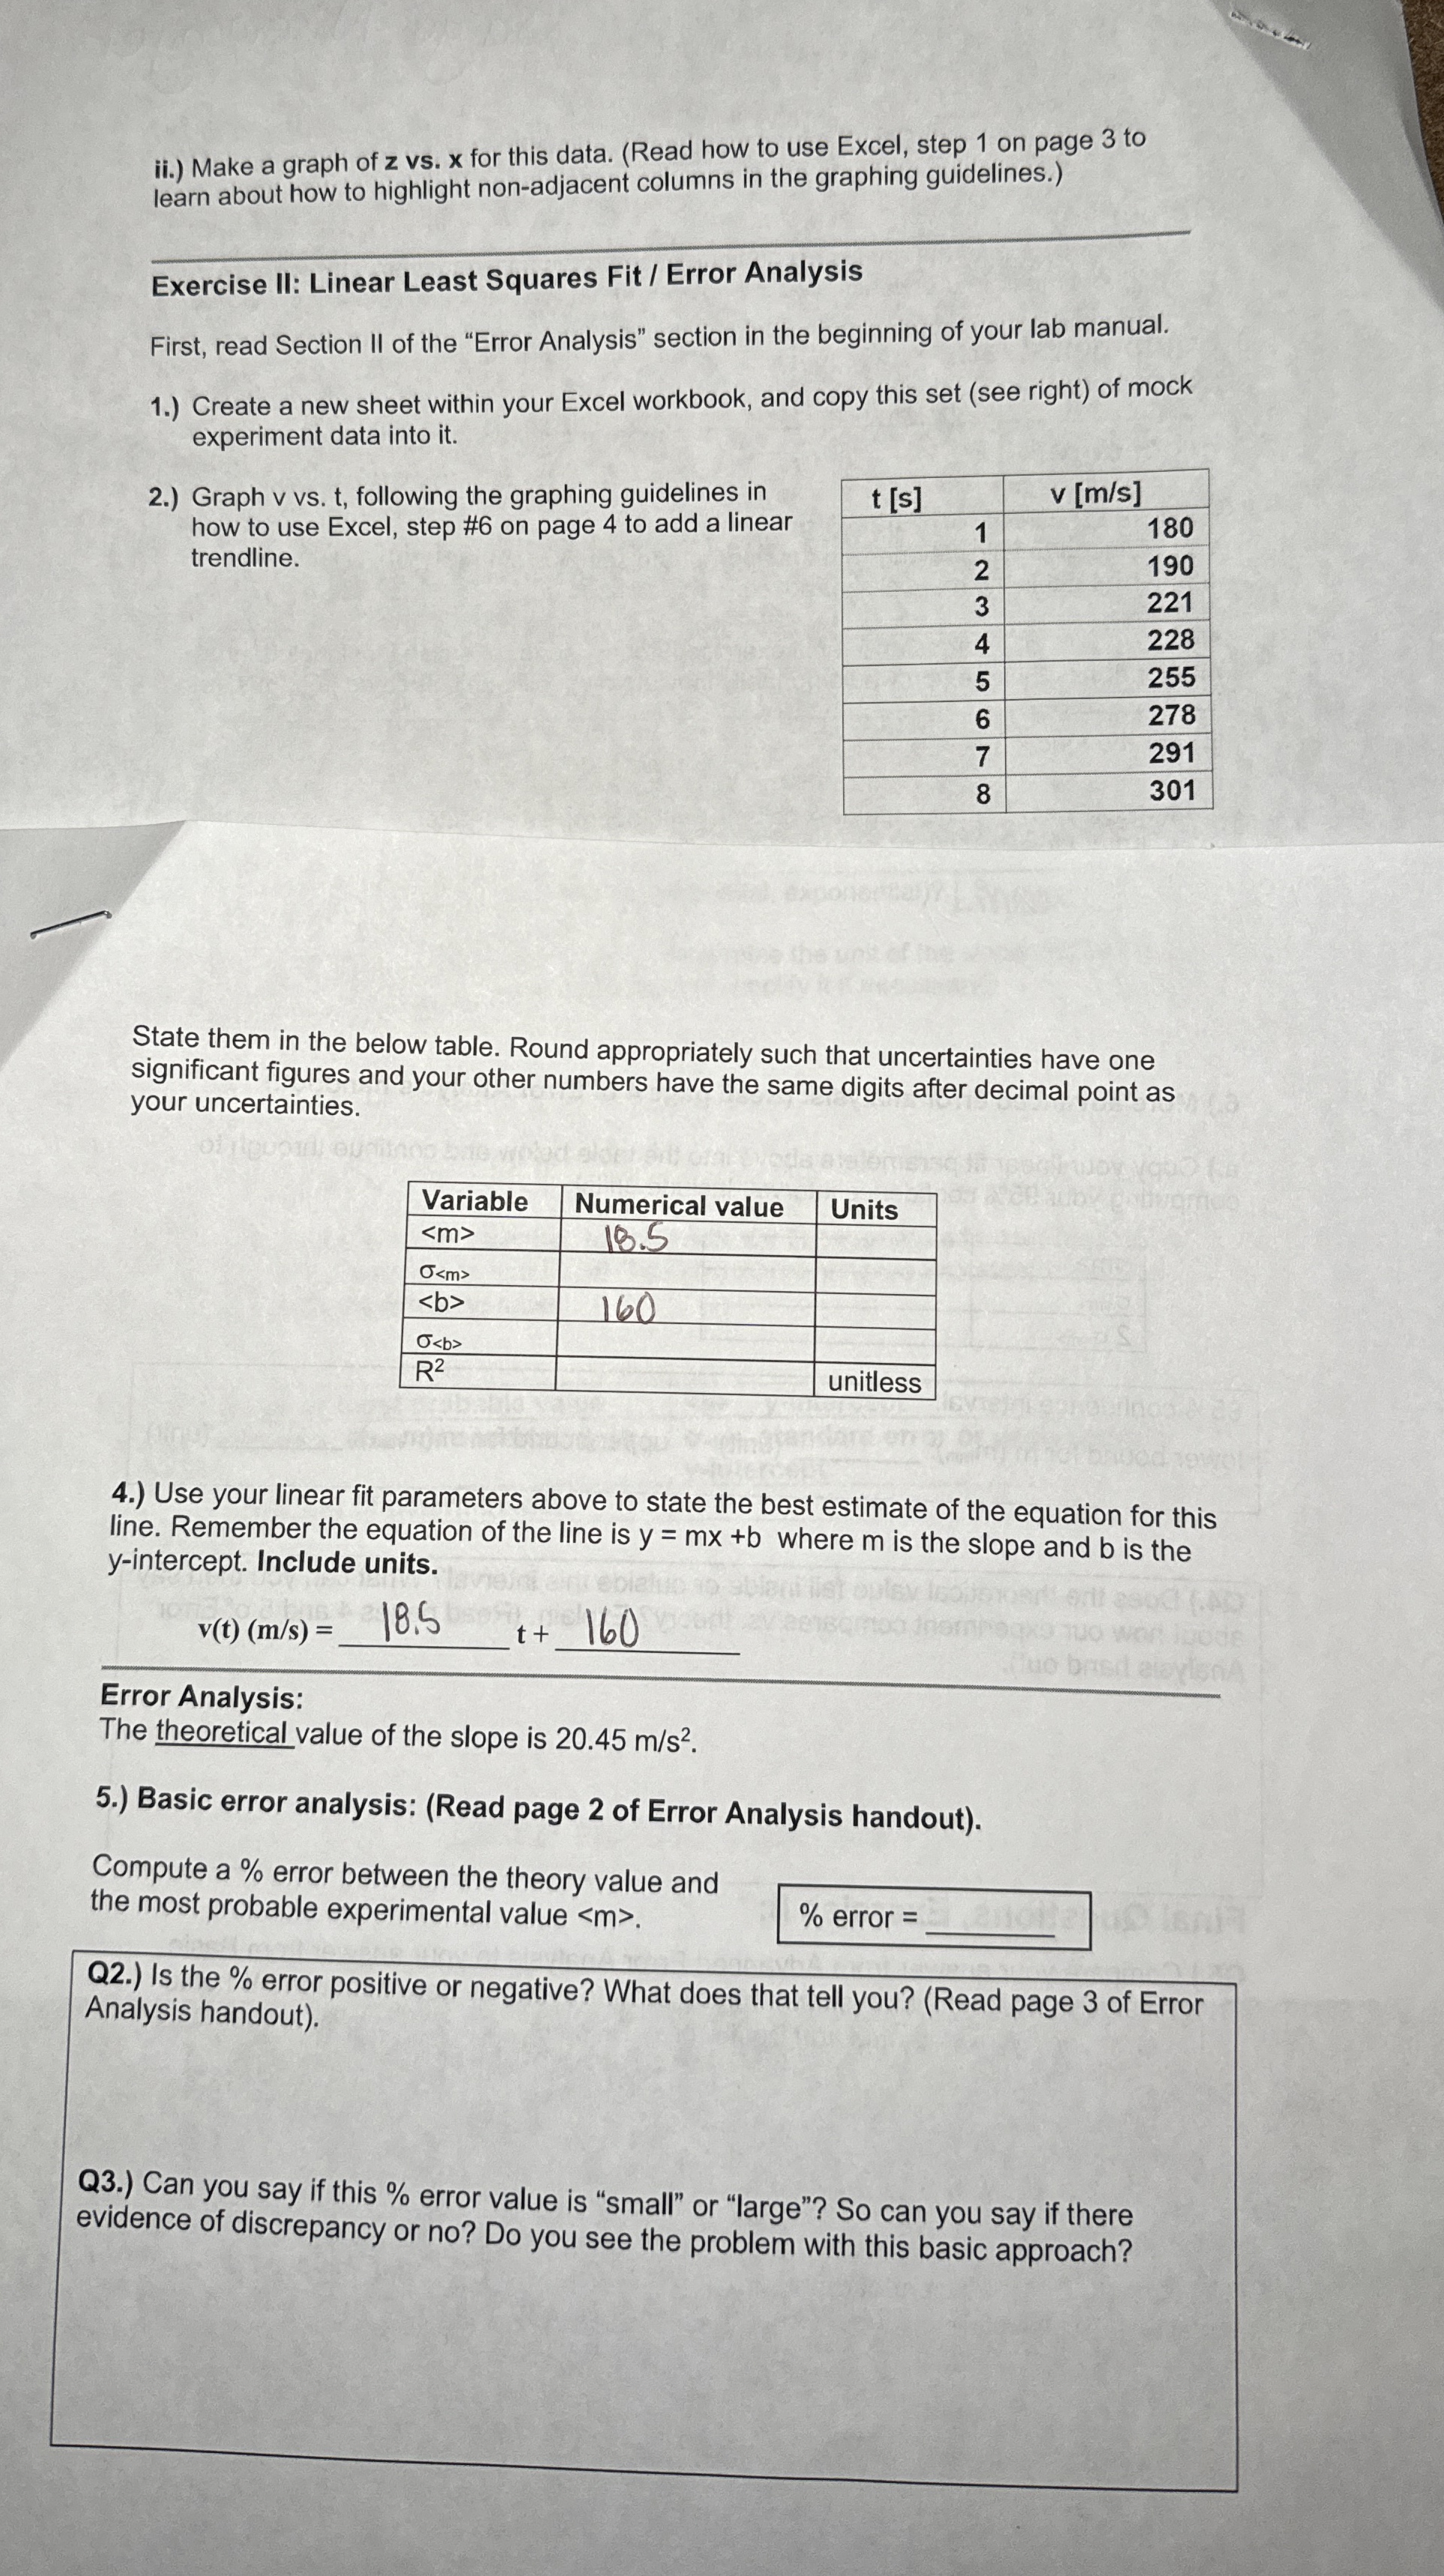
Create a new sheet within your Excel workbook, and copy this set see right of mock experiment data into it
Graph vs following the graphing guidelines in how to use Excel, step # on page to add a linear trendline.
table
Please help me solve this in enirely ive been struggling. There is a third page but it wont let me hpload ti finsih. Thanks
Step by Step Solution
There are 3 Steps involved in it
1 Expert Approved Answer
Step: 1 Unlock

Question Has Been Solved by an Expert!
Get step-by-step solutions from verified subject matter experts
Step: 2 Unlock
Step: 3 Unlock