

Question: ii Now suppose a = 3.20%, b = 103.00/US$, c = 4.40%, d = 1.50%, and e = 100.90/US$. By indexing the price levels of
ii Now suppose a = 3.20%, b = 103.00/US$, c = 4.40%, d = 1.50%, and e = 100.90/US$. By indexing the price levels of the two countries to 100 at the beginning of Year 1, compute the price levels of the two countries at the end of each of these five years. Compute the real values of US$1 in Japan (i.e., real exchange rate) at the end of each of these five years.
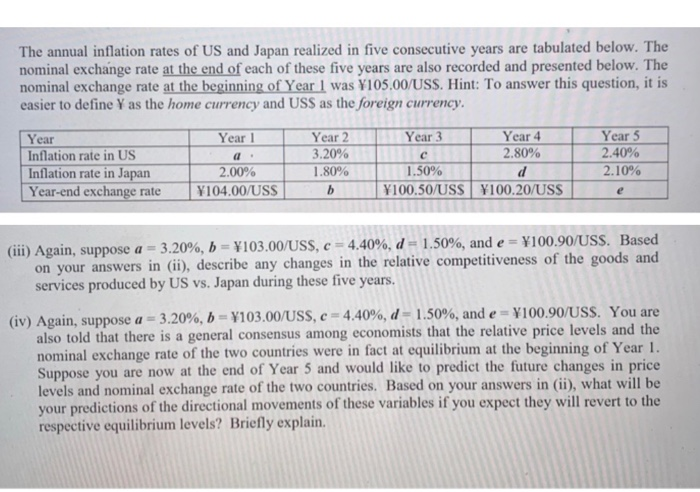
The annual inflation rates of US and Japan realized in five consecutive years are tabulated below. The nominal exchange rate at the end of each of these five years are also recorded and presented below. The nominal exchange rate at the beginning of Year I was Y105.00/USS. Hint: To answer this question, it is easier to define Y as the home currency and USS as the foreign currency. Year Inflation rate in US Inflation rate in Japan Year-end exchange rate Year 1 a 2.00% 104.00/USS Year 2 3.20% 1.80% b Year 3 Year 4 c 2.80% 1.50% d 100.50/USS 100.20/USS Year 5 2.40% 2.10% e (iii) Again, suppose a = 3.20%, b = 103.00/USS, c = 4.40%, d = 1.50%, and e = 100.90/USS. Based on your answers in (ii), describe any changes in the relative competitiveness of the goods and services produced by US vs. Japan during these five years. (iv) Again, suppose a = 3.20%, b = 103.00/USS, c = 4.40%, d - 1.50%, and e = 100.90/USS. You are also told that there is a general consensus among economists that the relative price levels and the nominal exchange rate of the two countries were in fact at equilibrium at the beginning of Year 1. Suppose you are now at the end of Year 5 and would like to predict the future changes in price levels and nominal exchange rate of the two countries. Based on your answers in (ii), what will be your predictions of the directional movements of these variables if you expect they will revert to the respective equilibrium levels? Briefly explain. The annual inflation rates of US and Japan realized in five consecutive years are tabulated below. The nominal exchange rate at the end of each of these five years are also recorded and presented below. The nominal exchange rate at the beginning of Year I was Y105.00/USS. Hint: To answer this question, it is easier to define Y as the home currency and USS as the foreign currency. Year Inflation rate in US Inflation rate in Japan Year-end exchange rate Year 1 a 2.00% 104.00/USS Year 2 3.20% 1.80% b Year 3 Year 4 c 2.80% 1.50% d 100.50/USS 100.20/USS Year 5 2.40% 2.10% e (iii) Again, suppose a = 3.20%, b = 103.00/USS, c = 4.40%, d = 1.50%, and e = 100.90/USS. Based on your answers in (ii), describe any changes in the relative competitiveness of the goods and services produced by US vs. Japan during these five years. (iv) Again, suppose a = 3.20%, b = 103.00/USS, c = 4.40%, d - 1.50%, and e = 100.90/USS. You are also told that there is a general consensus among economists that the relative price levels and the nominal exchange rate of the two countries were in fact at equilibrium at the beginning of Year 1. Suppose you are now at the end of Year 5 and would like to predict the future changes in price levels and nominal exchange rate of the two countries. Based on your answers in (ii), what will be your predictions of the directional movements of these variables if you expect they will revert to the respective equilibrium levels? Briefly explain
Step by Step Solution
There are 3 Steps involved in it

Get step-by-step solutions from verified subject matter experts